Results maps
 1980 results map
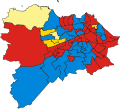 1984 results map
 1988 results map
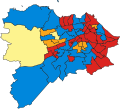 1992 results map
 1995 results map
 1999 results map
 2003 results map
 2007 results map
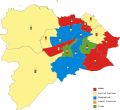 2012 results map
 2017 results map
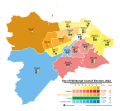 2022 results map
City of Edinburgh Council in Scotland holds elections every five years, previously holding them every four years from its creation as a single-tier authority in 1995 to 2007.
| Year | SNP | Labour | Liberal [a] | Conservative | Independent |
|---|---|---|---|---|---|
| 1974 | 1 | 29 | 3 | 30 | 1 |
| 1977 | 5 | 23 | 1 | 34 | 1 |
| 1980 [b] | 2 | 25 | 2 | 31 | 2 [c] |
| 1984 | 2 | 34 | 4 | 22 | 0 |
| 1988 | 2 | 33 | 4 | 23 | 0 |
| 1992 | 2 | 30 | 7 | 23 | 0 |
| Year | SNP | Labour | Liberal Democrats | Green | Conservative |
|---|---|---|---|---|---|
| 1995 | 0 | 34 | 10 | 0 | 14 |
| 1999 [a] | 1 | 31 | 13 | 0 | 13 |
| 2003 | 0 | 30 | 15 | 0 | 13 |
| 2007 [b] | 12 | 15 | 17 | 3 | 11 |
| 2012 | 18 | 20 | 3 | 6 | 11 |
| 2017 [c] | 19 | 12 | 6 | 8 | 18 |
| 2022 | 19 | 13 | 12 | 10 | 9 |


| Party | Candidate | Votes | % | ±% | |
|---|---|---|---|---|---|
| Liberal Democrats | Elizabeth O'Malley [5] | 883 | 43.1 | −15.6 | |
| Conservative | 743 | 36.3 | +17.1 | ||
| Green | 185 | 9.0 | +9.0 | ||
| Labour | 141 | 6.9 | −5.1 | ||
| SNP | 95 | 4.6 | −2.0 | ||
| Majority | 140 | 6.8 | |||
| Turnout | 2,047 | ||||
| Liberal Democrats hold | |||||
| Party | Candidate | Votes | % | ±% | |
|---|---|---|---|---|---|
| Conservative | Jason Rust [7] | 1,830 | 46.0 | −16.7 | |
| Liberal Democrats | 1,680 | 42.2 | +30.4 | ||
| Labour | 289 | 7.3 | −8.3 | ||
| SNP | 145 | 3.6 | −6.3 | ||
| Scottish Socialist | 38 | 1.0 | +1.0 | ||
| Majority | 150 | 3.8 | |||
| Turnout | 3,982 | ||||
| Conservative hold | |||||
| Party | Candidate | Votes | % | ±% | |
|---|---|---|---|---|---|
| Conservative | Jeremy Balfour | 1,327 | 50.0 | −0.4 | |
| Liberal Democrats | Michael Crockart | 859 | 32.4 | +10.5 | |
| Independent | Kristina Woolnough | 226 | 8.5 | +8.5 | |
| Labour | Norma Hart | 114 | 4.3 | −12.0 | |
| Green | Jill Boulton | 58 | 2.2 | +2.2 | |
| SNP | Sheena Cleland | 52 | 2.0 | −5.7 | |
| Liberal | Roy Isserlis | 12 | 0.5 | +0.5 | |
| UKIP | Melville Brown | 4 | 0.2 | +0.2 | |
| Majority | 468 | 17.6 | |||
| Turnout | 2,652 | ||||
| Conservative hold | |||||
| Party | Candidate | FPv% | Count | |||||||||
|---|---|---|---|---|---|---|---|---|---|---|---|---|
| 1 | 2 | 3 | 4 | 5 | 6 | 7 | 8 | 9 | ||||
| Labour | Cammy Day | 29.53 | 2,013 | 2,014 | 2,023 | 2,042 | 2,134 | 2,228 | 2,543 | 2,810 | 3,735 | |
| SNP | George Gordon | 27.01 | 1,841 | 1,843 | 1,849 | 1,861 | 1,920 | 2,005 | 2,259 | 2,529 | ||
| Conservative | Iain McGill | 17.31 | 1,180 | 1,184 | 1,187 | 1,188 | 1,199 | 1,225 | 1,453 | |||
| Liberal Democrats | Sanne C Djikstra-Downie | 14.45 | 985 | 987 | 989 | 995 | 1,033 | 1,155 | ||||
| Green | Kate Joester | 5.06 | 341 | 343 | 360 | 373 | 410 | |||||
| Independent | John Loughton | 4.36 | 297 | 303 | 307 | 323 | ||||||
| Solidarity | Willie Black | 1.17 | 80 | 80 | 84 | |||||||
| Scottish Socialist | Robert Richard | 1.0 | 53 | 54 | ||||||||
| Independent | James G MacLean | 0.1 | 26 | |||||||||
| Labour hold | ||||||||||||
| Valid: 6,816 Spoilt: 70 Quota: 3,409 Turnout: 6,886 | ||||||||||||
| Party | Candidate | FPv% | Count | |||||||
|---|---|---|---|---|---|---|---|---|---|---|
| 1 | 2 | 3 | 4 | 5 | 6 | 7 | ||||
| Labour | Bill Cook | 44.8 | 2,974 | 3,121 | 3,308 | |||||
| SNP | Richard Lewis | 20.8 | 1,382 | 1,484 | 1,698 | |||||
| Conservative | Stephanie Murray | 15.4 | 1,020 | 1,055 | 1,262 | |||||
| Liberal Democrats | John Christopher Knox | 10.9 | 722 | 816 | ||||||
| Green | Peter McColl | 3.0 | 201 | |||||||
| Scottish Socialist | Colin Fox | 2.5 | 169 | |||||||
| Independent | Mev Brown | 1.9 | 128 | |||||||
| Pirate | Philip Hunt | 0.6 | 43 | |||||||
| Labour hold | ||||||||||
| Valid: 6,639 Spoilt: 65 Quota: 3,320 Turnout: 6,704 | ||||||||||
| Party | Candidate | FPv% | Count | |||||
|---|---|---|---|---|---|---|---|---|
| 1 | 2 | 3 | 4 | 5 | ||||
| SNP | Alasdair Rankin | 23.1 | 797 | 825 | 893 | 1,081 | 1,368 | |
| Conservative | Iain McGill | 24.2 | 837 | 904 | 1,043 | 1,110 | 1,264 | |
| Labour | Karen Doran | 19.7 | 682 | 716 | 745 | 968 | ||
| Green | Melanie Main | 14.3 | 494 | 576 | 635 | |||
| Independent | John Carson | 11.4 | 394 | 402 | ||||
| Liberal Democrats | Alistair Hodgson | 7.3 | 251 | |||||
| SNP hold | ||||||||
| Valid: 3,455 Spoilt: 11 Quota: 1,728 Turnout: 3,466 | ||||||||
| Party | Candidate | FPv% | Count | |||||||
|---|---|---|---|---|---|---|---|---|---|---|
| 1 | 2 | 3 | 4 | 5 | 6 | 7 | ||||
| Labour | Keith John Robson | 39.5 | 2,892 | 2,896 | 2,906 | 2,941 | 3,070 | 3,255 | 3,448 | |
| SNP | Derek Howie | 30.7 | 2,249 | 2,251 | 2,256 | 2,287 | 2,403 | 2,523 | 2,633 | |
| Conservative | Stephanie Murray | 11.2 | 823 | 824 | 836 | 903 | 934 | 1,098 | ||
| Liberal Democrats | John Christopher Knox | 8.3 | 605 | 611 | 616 | 625 | 708 | |||
| Green | Alys Mumford | 5.6 | 412 | 430 | 440 | 471 | ||||
| UKIP | Jonathan Stanley | 3.2 | 235 | 239 | 251 | |||||
| Independent | John Scott | 0.9 | 64 | 70 | ||||||
| Pirate | Phil Hunt | 0.6 | 47 | |||||||
| Labour gain from SNP | ||||||||||
| Valid: 7,246 Spoilt: 81 Quota: 3,664 Turnout: 7,327 | ||||||||||
| Party | Candidate | FPv% | Count | ||||||||||
|---|---|---|---|---|---|---|---|---|---|---|---|---|---|
| 1 | 2 | 3 | 4 | 5 | 6 | 7 | 8 | 9 | 10 | ||||
| SNP | John Ritchie | 36.2 | 2,290 | ||||||||||
| Labour | Marion Donaldson | 25.7 | 1,623 | 1,650.1 | 1,653.1 | 1,659.6 | 1,661.7 | 1,680.4 | 1,697.6 | 1,798.2 | 1,990.2 | 2,717.3 | |
| Green | Susan Rae | 21.8 | 1,381 | 1,464.6 | 1,469.8 | 1,483.4 | 1,495.3 | 1,502.7 | 1,576.1 | 1,653.3 | 1,729.9 | ||
| Conservative | Gordon Murdie | 7.9 | 501 | 503.8 | 505.8 | 506.9 | 507.0 | 540.2 | 541.2 | 574.6 | |||
| Liberal Democrats | Mo Hussain | 4.0 | 255 | 261.6 | 263.0 | 265.3 | 265.3 | 267.4 | 271.6 | ||||
| UKIP | Alan Melville | 1.6 | 102 | 105.6 | 105.6 | 106.8 | 106.8 | ||||||
| Scottish Socialist | Natalie Reid | 1.5 | 97 | 107.7 | 107.7 | 108.2 | 122.0 | 125.2 | |||||
| Left Unity | Bruce Whitehead | 0.5 | 32 | 33.6 | 33.7 | 33.9 | |||||||
| Independent | John Scott | 0.4 | 26 | 29.0 | 30.0 | ||||||||
| Scottish Libertarian | Tom Laird | 0.3 | 17 | 17.9 | |||||||||
| SNP hold | |||||||||||||
| Labour gain from Green | |||||||||||||
| Valid: 6,324 Spoilt: 83 Quota: 2,109 Turnout: 6,407 | |||||||||||||
| Party | Candidate | FPv% | Count | |||||||||||
|---|---|---|---|---|---|---|---|---|---|---|---|---|---|---|
| 1 | 2 | 3 | 4 | 5 | 6 | 7 | 8 | 9 | 10 | 11 | ||||
| SNP | Rob Munn | 35.7 | 2,596 | 2,598 | 2,598 | 2,598 | 2,612 | 2,616 | 2,630 | 2,721 | 2,763 | 3,021 | 4,487 | |
| Green | Lorna Slater | 25.5 | 1,855 | 1,856 | 1,856 | 1,856 | 1,865 | 1,869 | 1,904 | 2,093 | 2,223 | 2,765 | ||
| Labour | Nick Gardner | 15.5 | 1,123 | 1,124 | 1,124 | 1,126 | 1,136 | 1,140 | 1,157 | 1,320 | 1,497 | |||
| Conservative | Dan McCroskrie | 10.7 | 777 | 777 | 779 | 781 | 784 | 811 | 825 | 912 | ||||
| Liberal Democrats | Jack Caldwell | 8.6 | 623 | 624 | 624 | 626 | 628 | 633 | 652 | |||||
| Independent | Kevin Illingworth | 1.5 | 110 | 112 | 112 | 122 | 126 | 143 | ||||||
| UKIP | Steven Alexander | 1.2 | 85 | 88 | 97 | 97 | 98 | |||||||
| Socialist Labour | David Jacobsen | 0.8 | 56 | 56 | 56 | 56 | ||||||||
| Independent | John Scott | 0.2 | 16 | 16 | 17 | |||||||||
| For Britain | Paul Stirling | 0.2 | 14 | 14 | ||||||||||
| Scottish Libertarian | Tom Laird | 0.2 | 12 | |||||||||||
| SNP gain from Labour | ||||||||||||||
| Valid: 7,267 Spoilt: 67 Quota: 3,634 Turnout: 7,334 | ||||||||||||||
| Party | Candidate | FPv% | Count | ||||||
|---|---|---|---|---|---|---|---|---|---|
| 1 | 2 | 3 | 4 | 5 | 6 | ||||
| SNP | Ethan Young | 38.9 | 2,920 | 2,924 | 2,936 | 3,004 | 3,716 | 3,818 | |
| Labour | Margaret Graham | 16.1 | 1,205 | 1,205 | 1,216 | 1,359 | 1,682 | 2,085 | |
| Conservative | Eleanor Price | 18.9 | 1,420 | 1,428 | 1,448 | 1,582 | 1,620 | ||
| Green | Benjamin Parker | 15.8 | 1,185 | 1,189 | 1,203 | 1,340 | |||
| Liberal Democrats | Elaine Ford | 8.4 | 631 | 634 | 647 | ||||
| Independent | Andrew McDonald | 1.2 | 93 | 100 | |||||
| Scottish Libertarian | Tam Laird | 0.6 | 42 | ||||||
| SNP hold | |||||||||
| Valid: 7,496 Spoilt: 86 Quota: 3,749 Turnout: 7,582 | |||||||||
| Party | Candidate | FPv% | Count | |
|---|---|---|---|---|
| 1 | ||||
| Liberal Democrats | Fiona Bennett | 56.0 | 4,577 | |
| SNP | Donald Rutherford | 13.3 | 1,086 | |
| Conservative | Hugh Findlay | 9.6 | 788 | |
| Labour | Richard Parker | 7.0 | 568 | |
| Green | Chris Young | 5.1 | 417 | |
| Independent | Elaine Miller | 3.7 | 327 | |
| Independent | Pete Gregson | 3.6 | 295 | |
| Scottish Family | Richard Fettes | 1.1 | 90 | |
| Scottish Libertarian | Gary Smith | 0.2 | 20 | |
| Liberal Democrats gain from SNP | ||||
| Valid: 8,168 Spoilt: 57 Quota: 4,085 Turnout: 8,225 | ||||
| Party | Candidate | FPv% | Count | |||||||||||
|---|---|---|---|---|---|---|---|---|---|---|---|---|---|---|
| 1 | 2 | 3 | 4 | 5 | 6 | 7 | 8 | 9 | 10 | 11 | ||||
| Liberal Democrats | Louise Spence | 36.3 | 2,683 | 2,684 | 2,685 | 2,687 | 2,697 | 2,704 | 2,763 | 2,793 | 2,898 | 3,096 | 3,751 | |
| Labour | Sheila Gilmore | 19.5 | 1,441 | 1,441 | 1,444 | 1,446 | 1,453 | 1,463 | 1,480 | 1,495 | 1,611 | 1,886 | 2,055 | |
| Conservative | Neil Cuthbert | 19.6 | 1,454 | 1,458 | 1,458 | 1,465 | 1,476 | 1,483 | 1,517 | 1,638 | 1,643 | 1,676 | ||
| SNP | Marianna Clyde | 10.8 | 800 | 800 | 800 | 801 | 806 | 816 | 826 | 835 | 963 | |||
| Green | Daniel Milligan | 5.3 | 393 | 393 | 396 | 397 | 402 | 407 | 414 | 423 | ||||
| Reform | Grant Lidster | 3.6 | 268 | 269 | 269 | 281 | 283 | 287 | 300 | |||||
| Independent | Marc Wilkinson | 2.3 | 173 | 173 | 175 | 177 | 179 | 190 | ||||||
| Independent | David Henry | 0.8 | 57 | 57 | 57 | 63 | 75 | |||||||
| Independent | Mev Brown | 0.7 | 50 | 51 | 60 | 62 | ||||||||
| Scottish Family | Richard Lucas | 0.7 | 51 | 51 | 51 | |||||||||
| Independent | Bonnie Prince Bob | 0.3 | 22 | 22 | ||||||||||
| Scottish Libertarian | Tam Laird | 0.1 | 9 | |||||||||||
| Liberal Democrats gain from Labour | ||||||||||||||
| Electorate: 19,907 Valid: 7,401 Spoilt: 45 Quota: 3,701 Turnout: 7,446 | ||||||||||||||
| Party | Candidate | FPv% | Count | |||||||||||||
|---|---|---|---|---|---|---|---|---|---|---|---|---|---|---|---|---|
| 1 | 2 | 3 | 4 | 5 | 6 | 7 | 8 | 9 | 10 | 11 | 12 | 13 | ||||
| Conservative | Neil Cuthbert | 32.6 | 2,027 | 2,027 | 2,028 | 2,030 | 2,034 | 2,039 | 2,050 | 2,100 | ||||||
| Labour | Connor Savage | 18.4 | 1,146 | 1,147 | 1,148 | 1,149 | 1,152 | 1,159 | 1,166 | 1,191 | 1,193 | 1,209 | 1,342 | 1,615 | 2,192 | |
| Liberal Democrats | Peter Nicholson | 16.2 | 1,009 | 1,009 | 1,009 | 1,009 | 1,012 | 1,015 | 1,023 | 1,059 | 1,064 | 1,103 | 1,187 | 1,380 | ||
| SNP | Marianna Clyde | 13.5 | 840 | 840 | 840 | 843 | 843 | 848 | 849 | 870 | 870 | 892 | 1,032 | |||
| Green | Daniel Milligan | 6.8 | 426 | 426 | 426 | 426 | 432 | 436 | 444 | 460 | 460 | 467 | ||||
| Reform | Grant Lidster | 5.5 | 345 | 345 | 345 | 347 | 348 | 354 | 364 | 384 | 387 | |||||
| Independent | Marc Wilkinson | 4.1 | 256 | 256 | 258 | 260 | 264 | 278 | 288 | |||||||
| Scottish Family | Richard Lucas | 1.0 | 65 | 65 | 68 | 69 | 70 | 70 | ||||||||
| Independent | David Henry | 0.6 | 38 | 38 | 43 | 54 | 61 | |||||||||
| Independent | Bonnie Prince Bob | 0.5 | 30 | 32 | 32 | 32 | ||||||||||
| Independent | Mev Brown | 0.4 | 23 | 23 | 25 | |||||||||||
| Independent | Nick Horning | 0.2 | 13 | 15 | ||||||||||||
| Independent | Mark Ney-Party | 0.1 | 5 | |||||||||||||
| Conservative gain from SNP | ||||||||||||||||
| Labour gain from Liberal Democrats | ||||||||||||||||
| Valid: 6,223 Spoilt: 58 Quota: 2,075 Turnout: 6,281 | ||||||||||||||||
| Party | Candidate | FPv% | Count | |||||||||||||
|---|---|---|---|---|---|---|---|---|---|---|---|---|---|---|---|---|
| 1 | 2 | 3 | 4 | 5 | 6 | 7 | 8 | 9 | 10 | 11 | 12 | 13 | ||||
| Liberal Democrats | Kevin McKay | 20.4 | 1,269 | 1,270 | 1,270 | 1,276 | 1,279 | 1,285 | 1,288 | 1,321 | 1,364 | 1,480 | 1,867 | 2,316 | 3,409 | |
| Labour | Catriona Munro | 20.8 | 1,293 | 1,293 | 1,295 | 1,297 | 1,304 | 1,307 | 1,314 | 1,335 | 1,368 | 1,502 | 1,668 | 2,219 | ||
| Green | Q Manivannan | 18.2 | 1,133 | 1,135 | 1,136 | 1,136 | 1,138 | 1,157 | 1,166 | 1,175 | 1,187 | 1,595 | 1,636 | |||
| Conservative | Mark Hooley | 13.8 | 857 | 858 | 861 | 862 | 865 | 865 | 868 | 884 | 1,080 | 1,109 | ||||
| SNP | Murray Visentin | 14.5 | 905 | 905 | 905 | 907 | 909 | 913 | 919 | 930 | 950 | |||||
| Reform | Gary Neill | 7.9 | 489 | 489 | 490 | 491 | 498 | 499 | 500 | 512 | ||||||
| Independent | Marc Wilkinson | 1.8 | 111 | 111 | 118 | 119 | 120 | 124 | 130 | |||||||
| Independent | Bonnie Prince Bob | 0.6 | 36 | 38 | 42 | 43 | 46 | 48 | ||||||||
| Independent | Steve West | 0.6 | 39 | 40 | 45 | 45 | 45 | |||||||||
| Scottish Family | Richard Lucas | 0.5 | 34 | 34 | 34 | 39 | ||||||||||
| Scottish Libertarian | Lukasz Furmaniak | 0.4 | 25 | 26 | 26 | |||||||||||
| Independent | Mark Rowbotham | 0.4 | 25 | 25 | ||||||||||||
| Independent | Derrick Emms | 0.1 | 9 | |||||||||||||
| Liberal Democrats gain from Labour | ||||||||||||||||
| Valid: 6,264 Spoilt: 39 Quota: 3,113 Turnout: 6,303 | ||||||||||||||||
| Edinburgh Corporation |
|
|---|---|
| City of Edinburgh District Council | |
| Lothian Regional Council | |
| City of Edinburgh Council | |
| Referendums | |