| Country of birth | Owned | Privately renting | Social renting |
|---|
| Households | % | Households | % | Households | % |
|---|
| Europe: United Kingdom: England | 956,436 | 57.1% | 317,375 | 19.0% | 400,222 | 23.9% |
| Europe: United Kingdom: Northern Ireland | 9,249 | 55.5% | 4,482 | 26.9% | 2,927 | 17.6% |
| Europe: United Kingdom: Scotland | 25,465 | 57.4% | 10,838 | 24.4% | 8,081 | 18.2% |
| Europe: United Kingdom: Wales | 16,209 | 64.2% | 6,165 | 24.4% | 2,874 | 11.4% |
| Europe: United Kingdom: Great Britain not otherwise specified | 21 | 33.3% | 15 | 23.8% | 27 | 42.9% |
| Europe: United Kingdom: United Kingdom not otherwise specified | 97 | 37.7% | 85 | 33.1% | 75 | 29.2% |
| Europe: Other Europe: EU countries: Member countries in March 2001: Ireland | 30,748 | 52.1% | 12,380 | 21.0% | 15,879 | 26.9% |
| Europe: Other Europe: EU countries: Member countries in March 2001: France | 13,083 | 37.2% | 19,451 | 55.3% | 2,621 | 7.5% |
| Europe: Other Europe: EU countries: Member countries in March 2001: Germany | 11,157 | 46.8% | 10,417 | 43.6% | 2,291 | 9.6% |
| Europe: Other Europe: EU countries: Member countries in March 2001: Italy | 19,356 | 36.6% | 29,912 | 56.6% | 3,566 | 6.7% |
| Europe: Other Europe: EU countries: Member countries in March 2001: Portugal (including Madeira and the Azores) | 5,282 | 21.7% | 12,587 | 51.7% | 6,482 | 26.6% |
| Europe: Other Europe: EU countries: Member countries in March 2001: Spain (including Canary Islands) | 7,483 | 29.7% | 15,014 | 59.6% | 2,675 | 10.6% |
| Europe: Other Europe: EU countries: Member countries in March 2001: Other member countries in March 2001 | 15,637 | 37.2% | 23,300 | 55.5% | 3,071 | 7.3% |
| Europe: Other Europe: EU countries: Countries that joined the EU between April 2001 and March 2011: Lithuania | 4,516 | 23.5% | 12,316 | 64.0% | 2,416 | 12.6% |
| Europe: Other Europe: EU countries: Countries that joined the EU between April 2001 and March 2011: Poland | 16,179 | 24.7% | 41,925 | 63.9% | 7,475 | 11.4% |
| Europe: Other Europe: EU countries: Countries that joined the EU between April 2001 and March 2011: Romania | 7,524 | 13.2% | 47,171 | 82.7% | 2,351 | 4.1% |
| Europe: Other Europe: EU countries: Countries that joined the EU between April 2001 and March 2011: Other EU countries | 24,334 | 32.9% | 40,668 | 55.0% | 8,873 | 12.0% |
| Europe: Other Europe: EU countries: Countries that joined the EU between April 2011 and March 2021: Croatia | 982 | 37.2% | 1,124 | 42.5% | 536 | 20.3% |
| Europe: Other Europe: Rest of Europe: Turkey | 8,867 | 24.6% | 13,905 | 38.5% | 13,346 | 37.0% |
| Europe: Other Europe: Rest of Europe: Other Europe | 22,162 | 30.0% | 38,609 | 52.2% | 13,142 | 17.8% |
| Africa: North Africa | 8,080 | 22.6% | 12,762 | 35.7% | 14,880 | 41.7% |
| Africa: Central and Western Africa: Ghana | 9,366 | 25.0% | 9,814 | 26.2% | 18,269 | 48.8% |
| Africa: Central and Western Africa: Nigeria | 18,150 | 28.4% | 19,731 | 30.9% | 25,992 | 40.7% |
| Africa: Central and Western Africa: Other Central and Western Africa | 4,846 | 11.2% | 12,535 | 29.1% | 25,696 | 59.7% |
| Africa: South and Eastern Africa: Kenya | 22,667 | 75.4% | 3,564 | 11.9% | 3,833 | 12.7% |
| Africa: South and Eastern Africa: Somalia | 968 | 2.7% | 8,367 | 23.4% | 26,371 | 73.9% |
| Africa: South and Eastern Africa: South Africa | 12,381 | 48.9% | 11,002 | 43.5% | 1,934 | 7.6% |
| Africa: South and Eastern Africa: Zimbabwe | 3,405 | 36.6% | 3,246 | 34.9% | 2,645 | 28.5% |
| Africa: South and Eastern Africa: Other South and Eastern Africa | 27,493 | 42.5% | 11,893 | 18.4% | 25,251 | 39.1% |
| Africa: Africa not otherwise specified | 511 | 48.3% | 166 | 15.7% | 381 | 36.0% |
| Middle East and Asia: Middle East: Iran | 8,742 | 34.7% | 10,823 | 43.0% | 5,626 | 22.3% |
| Middle East and Asia: Middle East: Iraq | 4,575 | 27.8% | 6,617 | 40.2% | 5,261 | 32.0% |
| Middle East and Asia: Middle East: Other Middle East | 9,968 | 30.9% | 16,483 | 51.0% | 5,840 | 18.1% |
| Middle East and Asia: Eastern Asia: China | 12,700 | 50.3% | 10,363 | 41.1% | 2,170 | 8.6% |
| Middle East and Asia: Eastern Asia: Hong Kong (Special Administrative Region of China) | 9,597 | 61.6% | 4,802 | 30.8% | 1,184 | 7.6% |
| Middle East and Asia: Eastern Asia: Other Eastern Asia | 6,051 | 38.7% | 8,634 | 55.3% | 932 | 6.0% |
| Middle East and Asia: Southern Asia: Afghanistan | 3,321 | 17.4% | 9,042 | 47.4% | 6,726 | 35.2% |
| Middle East and Asia: Southern Asia: India | 74,556 | 57.0% | 47,241 | 36.1% | 8,964 | 6.9% |
| Middle East and Asia: Southern Asia: Pakistan | 23,156 | 43.3% | 20,625 | 38.5% | 9,726 | 18.2% |
| Middle East and Asia: Southern Asia: Bangladesh | 15,991 | 26.1% | 18,171 | 29.6% | 27,194 | 44.3% |
| Middle East and Asia: Southern Asia: Sri Lanka | 18,435 | 49.3% | 13,811 | 37.0% | 5,125 | 13.7% |
| Middle East and Asia: Southern Asia: Other Southern Asia | 3,493 | 48.4% | 3,154 | 43.7% | 577 | 8.0% |
| Middle East and Asia: South-East Asia: Philippines | 7,381 | 31.8% | 10,239 | 44.1% | 5,581 | 24.1% |
| Middle East and Asia: South-East Asia: Malaysia | 6,654 | 64.8% | 2,768 | 26.9% | 851 | 8.3% |
| Middle East and Asia: South-East Asia: Singapore | 2,942 | 59.5% | 1,682 | 34.0% | 320 | 6.5% |
| Middle East and Asia: South-East Asia: Other South-East Asia | 6,848 | 38.6% | 4,961 | 28.0% | 5,937 | 33.5% |
| Middle East and Asia: Central Asia | 818 | 31.0% | 1,500 | 56.8% | 321 | 12.2% |
| The Americas and the Caribbean: North America: United States | 12,397 | 41.1% | 16,279 | 54.0% | 1,464 | 4.9% |
| The Americas and the Caribbean: North America: Canada | 5,223 | 47.3% | 5,296 | 48.0% | 522 | 4.7% |
| The Americas and the Caribbean: North America: Other North America | 172 | 32.8% | 309 | 58.9% | 44 | 8.4% |
| The Americas and the Caribbean: Central America: All Central American countries | 1,051 | 30.1% | 2,145 | 61.5% | 294 | 8.4% |
| The Americas and the Caribbean: South America: All South American countries | 15,468 | 23.7% | 37,044 | 56.8% | 12,693 | 19.5% |
| The Americas and the Caribbean: The Caribbean: Jamaica | 18,376 | 36.0% | 7,625 | 14.9% | 25,010 | 49.0% |
| The Americas and the Caribbean: The Caribbean: Other Caribbean | 13,724 | 42.4% | 5,723 | 17.7% | 12,895 | 39.9% |
| Antarctica and Oceania: Australasia: Australia | 10,400 | 46.7% | 11,061 | 49.7% | 798 | 3.6% |
| Antarctica and Oceania: Australasia: New Zealand | 5,641 | 53.6% | 4,364 | 41.4% | 525 | 5.0% |
| Antarctica and Oceania: Australasia: Other Australasia | 5 | 45.5% | 5 | 45.5% | 1 | 9.1% |
| Antarctica and Oceania: Other Oceania and Antarctica | 695 | 58.4% | 305 | 25.6% | 190 | 16.0% |
| Other | 7 | 58.3% | 1 | 8.3% | 4 | 33.3% |


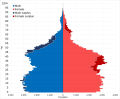
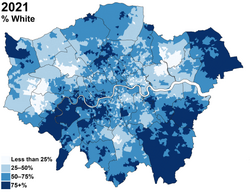
 White (2001-2021)
 White-British (2021)
 White-Irish (2021)
 White-Other White (2021)
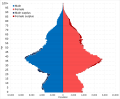
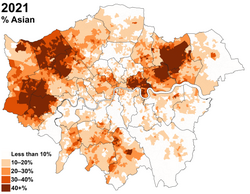
 Asian (2001-2021)
 Asian-Bangladeshi (2021)
 Asian-Chinese (2021)
 Asian-Indian (2021)
 Asian-Pakistani (2021)
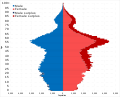
 Black (2001-2021)
 Black-African (2021)
 Black-Caribbean (2021)
 Other-Arab (2021)
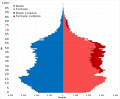
 Other-Any Other Ethnic Group (2021)