Demographics of Greater Manchester

Last updated

Demographics of Greater Manchester
Greater Manchester population pyramid 2020.svg
Population pyramid of Greater Manchester
Population2,685,400
Population density in the 2011 census in Greater Manchester. Population Density Greater Manchester 2011 Census.png
Population density in the 2011 census in Greater Manchester.

The demography of Greater Manchester is analysed by the Office for National Statistics and data is produced for each of its ten metropolitan boroughs, each of the Greater Manchester electoral wards, the NUTS3 statistical sub-regions, each of the Parliamentary constituencies in Greater Manchester, the 15 civil parishes in Greater Manchester, and for all of Greater Manchester as a whole; the latter of which had a population of 2,682,500 at the 2011 UK census. [1] Additionally, data is produced for the Greater Manchester Urban Area. Statistical information is produced about the size and geographical breakdown of the population, the number of people entering and leaving country and the number of people in each demographic subgroup.

Contents

Key statistics

Compared against the demographics of England, Greater Manchester's demographics are broadly inline with national averages on many topics. In terms of ethnicity, its Asian and British Asian population is considerably above the regional and national averages, as is the portion of residents who identify as Muslim. Compared against the demographics of the United Kingdom, Greater Manchester's ethnic minority population consists of 11.09% of the total population.[ citation needed ] NB. Information in the table on the right is from the 2001 census and not the most recent 2011 census.

As of 2020, the ONS estimates the population of the Greater Manchester Metropolitan County to be 2,835,686. [2]

Industry sectors in Greater Manchester over time Greater Manchester's industry over time.svg
Industry sectors in Greater Manchester over time

Population change

The population of Greater Manchester increased from around 328 thousand in 1801, to 2.5 million in 2001, peaking in 2011, at 2.7 million. 2011 census data shows a population of 2,685,400 Population of Greater Manchester.png
The population of Greater Manchester increased from around 328 thousand in 1801, to 2.5 million in 2001, peaking in 2011, at 2.7 million. 2011 census data shows a population of 2,685,400

The following is a table outlining population totals of the area for every ten years since 1801, using material from the census in the United Kingdom via the Great Britain Historical GIS; pre-1974 statistics were gathered from local government areas that now comprise Greater Manchester. The total population of Greater Manchester is predicted to grow to around 2,950,000 by 2031, with the City of Manchester alone accounting for 36% of the growth. [3]

Historical populations
YearPopulation±%
1801 328,609    
1811 409,464+24.6%
1821 526,230+28.5%
1831 700,486+33.1%
1841 860,413+22.8%
1851 1,037,001+20.5%
1861 1,313,550+26.7%
1871 1,590,102+21.1%
1881 1,866,649+17.4%
1891 2,125,318+13.9%
1901 2,357,150+10.9%
1911 2,617,598+11.0%
YearPopulation±%
1921 2,660,088+1.6%
1931 2,707,070+1.8%
1941 2,693,775−0.5%
1951 2,688,987−0.2%
1961 2,699,711+0.4%
1971 2,729,741+1.1%
1981 2,575,441−5.7%
1991 2,569,700−0.2%
2001 2,482,352−3.4%
2011 2,685,400+8.2%
2021 2,867,752+6.8%
Source: A Vision of Britain through Time. [4]

Boroughs

Manchester has always been vastly more populous than any other district of Greater Manchester. Greater Manchester Population.png
Manchester has always been vastly more populous than any other district of Greater Manchester.

According to the 2011 census, of Greater Manchester's ten metropolitan boroughs, the City of Manchester is the most populous with a population of 503,127, whilst the Metropolitan Borough of Bury is the least populous with 185,100. The City of Manchester's population in 2021 is predicted at 532,200. [5] The city experienced the greatest percentage population growth outside London, with an increase of 19% to over 500,000. [6] Manchester's population according to the 2021 census is 549,853, an increase of 9.2% from 2011. This represents a slower rate of growth than the previous decade. [5]

In terms of ethnic composition, the City of Manchester has the highest non-white population in Greater Manchester (34th in England), followed by the metropolitan boroughs of Oldham (45th in England), Rochdale (53rd in England), and Trafford (68th in England). Wigan is the least ethnically diverse borough in the county, and 274th in England.

The Metropolitan Borough of Oldham is the borough with the highest proportion of people under fifteen years of age. [7] Almost 12% of people in the Metropolitan Borough of Oldham are of South Asian heritage, the highest proportion of a borough of Greater Manchester. [7]

With greater affluence, a recent trend has seen some of the Pakistani community move out of the inner city into more spacious suburbs. In South Manchester this means that they have been moving from Longsight/Levenshulme to more suburban areas such as Cheadle, Chorlton and Heaton Mersey. The inner city areas that are being left are generally filled with newer immigrants from places like Iran, Afghanistan and Poland. [ permanent dead link ] Archived 22 October 2008 at the Wayback Machine [ dead link ]

Rank
2011
Rank
2001
Metropolitan districtPopulation in 2011Change 2001–2011
11 Manchester 503,127Increase2.svg28.1%
22 Wigan 317,800Increase2.svg5.4%
33 Stockport 283,300Decrease2.svg0.4%
44 Bolton 276,800Increase2.svg6.0%
56 Salford 233,900Increase2.svg8.2%
68 Trafford 226,600Increase2.svg7.8%
75 Oldham 224,900Increase2.svg3.5%
87 Tameside 219,300Increase2.svg2.9%
99 Rochdale 211,700Increase2.svg3.2%
1010 Bury 185,100Increase2.svg2.5%

Ethnicity

The following table shows the ethnic group of respondents in the 1991, 2001, 2011 and 2021 censuses in Greater Manchester.

Ethnic GroupYear
1971 estimations [8] 1981 estimations [9] 1991 census [10] 2001 census [11] 2011 census [12] 2021 census [13]
Number%Number%Number%Number%Number%Number%
White: Total97.9%2,513,54596%2,414,41793.9%2,260,50791.1%2,248,12383.81%2,190,83876.4%
White: British [Note 1] 2,183,09687.95%2,141,68779.84%2,045,95171.3%
White: Irish 42,6461.72%34,4991.29%30,9071.1%
White: Gypsy or Irish Traveller [Note 2] 1,5230.06%2,4090.1%
White: Roma 3,2740.1%
White: Other [Note 1] 34,7651.40%70,4142.62%108,2973.8%
Asian or Asian British: Total70,6702.7%108,6514.2%151,8766.1%272,17310.15%389,28313.5%
Asian or Asian British: Indian 22,05330,90935,9311.45%53,4611.99%69,4812.4%
Asian or Asian British: Pakistani 33,26452,10775,1873.03%130,0124.85%209,0617.3%
Asian or Asian British: Bangladeshi 6,15611,95820,0640.81%34,1861.27%46,4601.6%
Asian or Asian British: Chinese [Note 3] 5,9458,58011,8580.48%26,0790.97%29,5821.0%
Asian or Asian British: Other Asian3,2525,0978,8360.36%28,4351.06%34,6991.2%
Black or Black British: Total25,4161%33,9481.3%29,7471.2%74,0972.76%134,1144.7%
Black or Black British: African 4,0715,63816,2330.65%44,6911.67%98,5573.4%
Black or Black British: Caribbean 14,11918,37110,2550.41%17,7670.66%19,7110.7%
Black or Black British: Other Black 7,2269,9393,2590.13%11,6390.43%15,8460.6%
Mixed or British Mixed: Total [Note 1] 32,9011.3%60,7102.26%86,5203.1%
Mixed: White and Black Caribbean13,1040.53%23,1310.86%27,9061.0%
Mixed: White and Black African4,8600.20%9,9970.37%16,3790.6%
Mixed: White and Asian8,5470.34%15,6570.58%23,0050.8%
Mixed: Other Mixed6,3900.26%11,9250.44%19,2300.7%
Other: Total9,46713,5777,2970.29%27,4251.02%66,9972.4%
Other: Arab [Note 4] 15,0260.56%27,3221.0%
Other: Any other ethnic group7,2970.29%12,3990.46%39,6751.4%
Non-White: Total2.1%105,5534%156,1836.1%221,8218.9%434,40516.2%676,91423.6%
Total100%2,619,098100%2,570,600100.00%2,482,328100.00%2,682,528100.00%2,867,752100%

Notes for table above

  1. New category created for the 2001 census
  2. New category created for the 2011 census
  3. In 2001, listed under the 'Other ethnic group' heading.

Languages

The most common main languages spoken in Greater Manchester according to the 2011 census are shown below. [14]

RankLanguageUsual residents aged 3+Proportion
1 English 2,370,09492.12%
2 Urdu 31,7121.23%
3 Polish 21,2310.83%
4 Bengali (with Sylheti and Chatgaya)16,9460.66%
5 Punjabi 16,1890.63%
6 Gujarati 11,6510.45%
7 Arabic 10,9140.42%
8 Persian 5,6540.22%
9 French 4,9240.19%
10 Somali 3,8680.15%
11 Kurdish 3,6560.14%
12 Portuguese 3,6200.14%
13 Cantonese Chinese 3,4400.13%
14 Spanish 3,2520.13%
15 Pashto 2,6840.10%
16 Italian 2,2920.09%
17 Greek 2,1990.09%
18 Czech 2,1290.08%
19 German 2,0880.08%
20 Pakistani Pahari (with Mirpuri and Potwari)1,9910.08%
Other52,1972.03%

Religion

The following table shows the religion of respondents in the 2001 and 2011 censuses in Greater Manchester.

Religion2001 [15] 2011 [16] 2021 [17]
Number%Number%Number%
Christian1,840,59974.151,657,59461.791,347,10446.97
Buddhist5,1560.219,5550.369,5290.33
Hindu17,2600.7023,4780.8827,8920.97
Jewish21,7330.8825,0130.9328,0750.98
Muslim125,2195.04232,7878.68373,87713.04
Sikh3,7200.155,3220.207,3530.26
Other religion4,3010.177,4290.2810,8010.38
No religion281,27311.33%557,12920.77915,59231.93
Religion not stated183,0677.37%164,2216.12%147,5415.14
Total2,482,328100.00%2,682,528100.00%2,867,752100.00%

Eurostat NUTS

In the Eurostat Nomenclature of Territorial Units for Statistics (NUTS), Greater Manchester is a level-2 NUTS region, coded "UKD3", which is subdivided into the "Greater Manchester South" (UKD31) and "Greater Manchester North" (UKD32) level-3 regions.

Urban and metropolitan area

At the 2001 census, the population of the Greater Manchester Urban Area was 2,240,230. [18] This area does not include some outliers within Greater Manchester, such as Wigan, but does extend into the adjacent counties of Lancashire and Cheshire. Eurostat has developed a harmonising standard for comparing metropolitan areas in the European Union and the population of the Greater Manchester Larger Urban Zone is 2,600,100; it occupies an area of 1,280 square kilometres (490 sq mi). The Greater Manchester LUZ is the second most populous within the United Kingdom, behind that of London, and sixteenth most populous within the EU.

See also

Notes

  1. 1 2 3 New category created for the 2001 census
  2. New category created for the 2011 census
  3. In 2001, listed under the 'Other ethnic group' heading.
  4. New category created for the 2011 census

Related Research Articles

<span class="mw-page-title-main">Metropolitan Borough of Rochdale</span> Borough of Greater Manchester, England

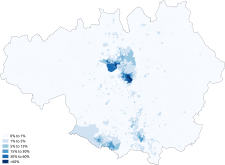
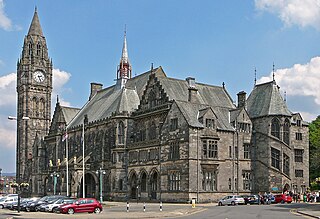
The Metropolitan Borough of Rochdale is a metropolitan borough of Greater Manchester in England. Its largest town is Rochdale and the wider borough covers other outlying towns and villages, including Middleton, Heywood, Milnrow and Littleborough. It is the ninth-largest district by population in Greater Manchester with a population of 226,992 in 2022.

<span class="mw-page-title-main">Metropolitan Borough of Wigan</span> Borough of Greater Manchester, England

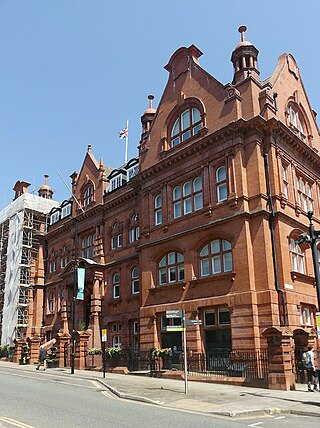
The Metropolitan Borough of Wigan is a metropolitan borough of Greater Manchester, England. It is named after its largest town, Wigan but covers a far larger area which includes the towns of Atherton, Ashton-in-Makerfield, Golborne, Hindley, Ince-in-Makerfield, Leigh and Tyldesley. The borough also covers the villages and suburbs of Abram, Aspull, Astley, Bryn, Hindley Green, Lowton, Mosley Common, Orrell, Pemberton, Shevington, Standish, Winstanley and Worsley Mesnes. The borough is also the second-most populous district in Greater Manchester.

<span class="mw-page-title-main">Metropolitan Borough of Oldham</span> Borough of Greater Manchester, England

The Metropolitan Borough of Oldham is a metropolitan borough of Greater Manchester in England. It is named after its largest town, Oldham. The borough had a population of 243,912 in 2022, making it the sixth-largest district by population in Greater Manchester. The borough spans 142 square kilometres (55 sq mi).

<span class="mw-page-title-main">Uppermill</span> Human settlement in England

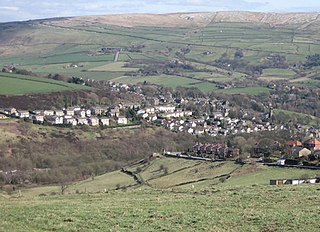
Uppermill is a village in the civil parish of Saddleworth in the Metropolitan Borough of Oldham, Greater Manchester, England. Historically in the West Riding of Yorkshire, it lies on the River Tame in a valley amongst the South Pennines with the Peak District National Park directly to the east, 5 miles (8.0 km) east of Oldham and 11 miles (17.7 km) northeast of Manchester. Uppermill and the neighbouring village of Dobcross have a combined population of 7,500.

<span class="mw-page-title-main">Abram, Greater Manchester</span> Human settlement in England

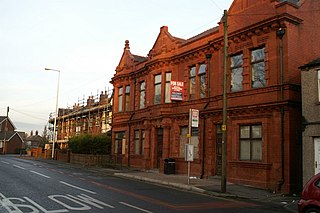
Abram is a village and electoral ward in the Metropolitan Borough of Wigan, Greater Manchester, England. It lies on flat land on the northeast bank of the Leeds and Liverpool Canal, 2 miles (3.2 km) west of Leigh, 3 miles (4.8 km) southeast of Wigan, and 14.5 miles (23 km) west of Manchester. Abram is a dormitory village with a population of 9,855.

<span class="mw-page-title-main">Metropolitan Borough of Stockport</span> Borough of Greater Manchester, England

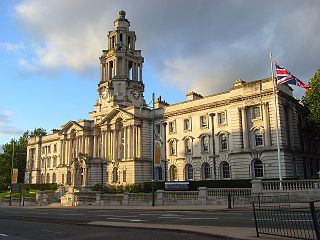
The Metropolitan Borough of Stockport is a metropolitan borough of Greater Manchester in England. It is south-east of central Manchester and south of Tameside. As well as the towns of Stockport, Bredbury and Marple, it includes the outlying villages and suburbs of Hazel Grove, Bramhall, Cheadle, Cheadle Hulme, Gatley, Reddish, Woodley and Romiley. In 2022, it had a population of 297,107, making it the fourth-most populous borough of Greater Manchester.

<span class="mw-page-title-main">Greater Manchester Built-up Area</span> Conurbation in England

The Greater Manchester Built-up Area is an area of land defined by the Office for National Statistics (ONS), consisting of the large conurbation that encompasses the urban element of the city of Manchester and the metropolitan area that forms much of Greater Manchester in North West England. According to the United Kingdom Census 2011, the Greater Manchester Built-up Area has a population of 2,553,379 making it the second most populous conurbation in the United Kingdom after the Greater London Built-up Area. This was an increase of 14% from the population recorded at the United Kingdom Census 2001 of 2,240,230, when it was known as the Greater Manchester Urban Area.

<span class="mw-page-title-main">Demographics of London</span>

The demography of London is analysed by the Office for National Statistics and data is produced for each of the Greater London wards, the City of London and the 32 London boroughs, the Inner London and Outer London statistical sub-regions, each of the Parliamentary constituencies in London, and for all of Greater London as a whole. Additionally, data is produced for the Greater London Urban Area. Statistical information is produced about the size and geographical breakdown of the population, the number of people entering and leaving country and the number of people in each demographic subgroup. The total population of London as of 2021 is 8,799,800.

<span class="mw-page-title-main">Demographics of Slough</span>

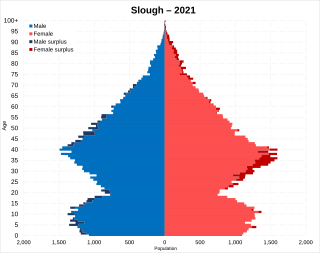
This article is intended to give an overview of the demography of Slough. In 2016, Slough had a population of 149,000 people.

<span class="mw-page-title-main">Demographics of Birmingham</span>

The demography of Birmingham, England, is analysed by the Office for National Statistics and data produced for each of the wards that make up the city, and the overall city itself, which is the largest city proper in England as well as the core of the third most populous urban area, the West Midlands conurbation.

<span class="mw-page-title-main">Dobcross</span> Human settlement in England

Dobcross is a village in the civil parish of Saddleworth in the Metropolitan Borough of Oldham in Greater Manchester, England. It is in a valley in the South Pennines, along the course of the River Tame and the Huddersfield Narrow Canal, 4.2 miles (6.8 km) east-northeast of Oldham and 13 miles (21 km) west-southwest of Huddersfield.

<span class="mw-page-title-main">Demographics of Leicester</span>

Leicester, England is an ethnically and culturally diverse city. It is the thirteenth most populous city in the United Kingdom.

<span class="mw-page-title-main">Demographics of Nottingham</span>

Nottingham, England is an ethnically and culturally diverse city. It is the sixteenth most populous city in the United Kingdom.

<span class="mw-page-title-main">Demographics of Luton</span> Statistics regarding ethnicity, religion and language in Luton, Bedfordshire, England

Luton, Bedfordshire, England is an ethnically and culturally diverse town of 203,201 people. It's primarily urban, with a population density of 4,696/km2 (12,160/sq mi). Luton has seen several waves of immigration. In the early part of the 20th century, there was internal migration of Irish and Scottish people to the town. These were followed by Afro-Caribbean and Asian immigrants. More recently immigrants from other European Union countries have made Luton their home. As a result of this Luton has a diverse ethnic mix, with a significant population of Asian descent, mainly Pakistani 29,353 (14.4%) and Bangladeshi 13,606 (6.7%).

<span class="mw-page-title-main">Demographics of Bradford</span>

Bradford, England is an ethnically and culturally diverse city. The City of Bradford metropolitan borough is the sixth most populous local authority district in the United Kingdom, and includes not only Bradford but also the towns and villages of Keighley, Shipley, Bingley, Ilkley, Haworth, Silsden, Queensbury, Thornton and Denholme.

<span class="mw-page-title-main">Demographics of Leeds</span>

Leeds, England is the third most populous city in the United Kingdom.

<span class="mw-page-title-main">Demographics of Glasgow</span> Demographics of the most populous city in Scotland

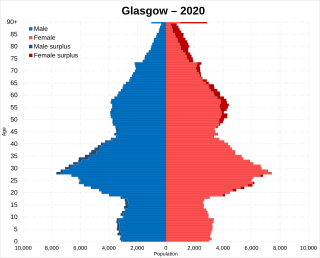
Glasgow is the most populous city in Scotland and the fourth most populous city in the United Kingdom.

<span class="mw-page-title-main">Demographics of Bristol</span>

Bristol, England is the tenth most populous city in the United Kingdom.

<span class="mw-page-title-main">Demographics of Coventry</span> Demographic overview of the UK city

Coventry, England is an ethnically and culturally diverse city. It is the fifteenth most populous city in the United Kingdom.

<span class="mw-page-title-main">Demographics of Manchester</span> Demographic overview of the UK city

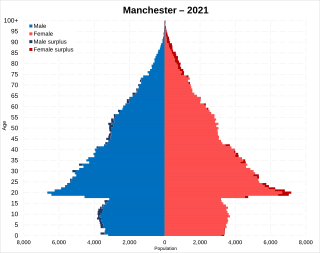
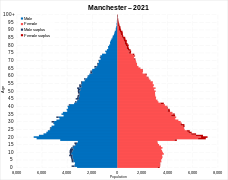
Manchester is a populous city in the North West of England. Its total population as of 2021 is 551,938.

References

  1. "2011 Census, Greater Manchester Gets Bigger". manchesterconfidential.co.uk. 18 July 2012. Archived from the original on 30 August 2012. Retrieved 1 October 2012.
  2. "Estimates of the population for the UK, England and Wales, Scotland and Northern Ireland". Office for National Statistics. 24 June 2020. Retrieved 18 October 2020.
  3. Times Books 2012, p. 192.
  4. A Vision of Britain through time. "Greater Manchester Met.C: Total Population" . Retrieved 6 April 2007.
  5. 1 2 Council, Manchester City. "Manchester City Council download - Population reports - The Council & democracy - Statistics & intelligence". www.manchester.gov.uk. Retrieved 19 April 2018.
  6. Westcott, Lucy Townsend and Kathryn (17 July 2012). "Five lesser-spotted things in the census". BBC News. Retrieved 19 April 2018.
  7. 1 2 "BOROUGH PROFILE: Oldham". Greater Manchester Fire and Rescue Service. 2002. Archived from the original on 18 May 2007. Retrieved 10 February 2007.
  8. Explaining ethnic differences: Changing patterns of disadvantage in Britain (1 ed.). Bristol University Press. 2003.
  9. Ethnicity in the 1991 census: Vol 3 - Social geography and ethnicity in Britain, geographical spread, spatial concentration and internal migration. Internet Archive. London : HMSO. 1996. ISBN   978-0-11-691655-6.{{cite book}}: CS1 maint: others (link)
  10. Ethnicity in the 1991 census: Vol 3 - Social geography and ethnicity in Britain, geographical spread, spatial concentration and internal migration. Internet Archive. London : HMSO. 1996. ISBN   978-0-11-691655-6.{{cite book}}: CS1 maint: others (link)
  11. "Office of National Statistics; 2001 Census Key Statistics". webarchive.nationalarchives.gov.uk. Retrieved 7 September 2021.
  12. "2011 Census: Ethnic Group, local authorities in England and Wales". webarchive.nationalarchives.gov.uk. Retrieved 15 December 2021.
  13. "Ethnic group - Office for National Statistics". www.ons.gov.uk. Retrieved 19 December 2022.
  14. "Download:local authorities: county / unitary". NOMIS. Retrieved 5 September 2014.
  15. "2001 census - theme tables" . Retrieved 5 September 2014.
  16. "Download:local authorities: county / unitary". NOMIS. Retrieved 2 September 2014.
  17. "Religion - Office for National Statistics".
  18. Key Statistics for urban areas in England and Wales Archived 15 February 2006 at the Wayback Machine , 2001 Census. URL accessed 21 February 2007.

Bibliography