Resource depletion is the consumption of a resource faster than it can be replenished. Natural resources are commonly divided between renewable resources and non-renewable resources. The use of either of these forms of resources beyond their rate of replacement is considered to be resource depletion. The value of a resource is a direct result of its availability in nature and the cost of extracting the resource. The more a resource is depleted the more the value of the resource increases. There are several types of resource depletion, the most known being: Aquifer depletion, deforestation, mining for fossil fuels and minerals, pollution or contamination of resources, slash-and-burn agricultural practices, soil erosion, and overconsumption, excessive or unnecessary use of resources.
A renewable resource is a natural resource which will replenish to replace the portion depleted by usage and consumption, either through natural reproduction or other recurring processes in a finite amount of time in a human time scale. When the recovery rate of resources is unlikely to ever exceed a human time scale, these are called perpetual resources. Renewable resources are a part of Earth's natural environment and the largest components of its ecosphere. A positive life-cycle assessment is a key indicator of a resource's sustainability.

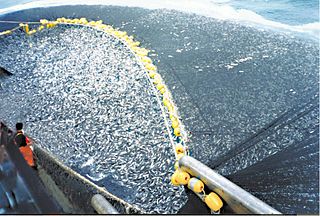
The fishing industry includes any industry or activity that takes, cultures, processes, preserves, stores, transports, markets or sells fish or fish products. It is defined by the Food and Agriculture Organization as including recreational, subsistence and commercial fishing, as well as the related harvesting, processing, and marketing sectors. The commercial activity is aimed at the delivery of fish and other seafood products for human consumption or as input factors in other industrial processes. The livelihood of over 500 million people in developing countries depends directly or indirectly on fisheries and aquaculture.

Energy development is the field of activities focused on obtaining sources of energy from natural resources. These activities include the production of renewable, nuclear, and fossil fuel derived sources of energy, and for the recovery and reuse of energy that would otherwise be wasted. Energy conservation and efficiency measures reduce the demand for energy development, and can have benefits to society with improvements to environmental issues.
The United Kingdom's Climate Change Programme was launched in November 2000 by the British government in response to its commitment agreed at the 1992 United Nations Conference on Environment and Development (UNCED). The 2000 programme was updated in March 2006 following a review launched in September 2004.

Energy in the United Kingdom came mostly from fossil fuels in 2021. Total energy consumption in the United Kingdom was 142.0 million tonnes of oil equivalent in 2019. In 2014, the UK had an energy consumption per capita of 2.78 tonnes of oil equivalent compared to a world average of 1.92 tonnes of oil equivalent. Demand for electricity in 2014 was 34.42 GW on average coming from a total electricity generation of 335.0 TWh.
The primary natural resources of the Republic of Ireland include natural gas, petroleum, peat, copper, lead, dolomite, barite, limestone, gypsum, silver and zinc. Key industries based on these and other natural resources include fishing, mining, and various forms of agriculture and fish farming. The Department of Communications, Energy and Natural Resources is charged with the legislative protection of Ireland's natural resources.
The natural environment, commonly referred to simply as the environment, is all living and non-living things that occur naturally on Earth or some part of it. This includes complete ecological units that function as natural systems without massive human intervention, including all vegetation, animals, microorganisms, rocks, atmosphere and natural phenomena that occur within their boundaries. And it includes universal natural resources and physical phenomena that lack clear-cut boundaries, such as air, water, and climate, as well as energy, radiation, electric charge, and magnetism, not originating from human activity.

Greenhouse gas (GHG) emissions from human activities intensify the greenhouse effect. This contributes to climate change. Carbon dioxide, from burning fossil fuels such as coal, oil, and natural gas, is one of the most important factors in causing climate change. The largest emitters are China followed by the United States. The United States has higher emissions per capita. The main producers fueling the emissions globally are large oil and gas companies. Emissions from human activities have increased atmospheric carbon dioxide by about 50% over pre-industrial levels. The growing levels of emissions have varied, but have been consistent among all greenhouse gases. Emissions in the 2010s averaged 56 billion tons a year, higher than any decade before. Total cumulative emissions from 1870 to 2017 were 425±20 GtC from fossil fuels and industry, and 180±60 GtC from land use change. Land-use change, such as deforestation, caused about 31% of cumulative emissions over 1870–2017, coal 32%, oil 25%, and gas 10%.

The production of renewable energy in Scotland is a topic that came to the fore in technical, economic, and political terms during the opening years of the 21st century. The natural resource base for renewable energy is high by European, and even global standards, with the most important potential sources being wind, wave, and tide. Renewables generate almost all of Scotland's electricity, mostly from the country's wind power.

A green-collar worker is a worker who is employed in an environmental sector of the economy. Environmental green-collar workers satisfy the demand for green development. Generally, they implement environmentally conscious design, policy, and technology to improve conservation and sustainability. Formal environmental regulations as well as informal social expectations are pushing many firms to seek professionals with expertise with environmental, energy efficiency, and clean renewable energy issues. They often seek to make their output more sustainable, and thus more favorable to public opinion, governmental regulation, and the Earth's ecology.
China has set the goal of attaining one percent of its renewable energy generation through bioenergy in 2020.
Greenhouse gas emissions by Australia totalled 533 million tonnes CO2-equivalent based on greenhouse gas national inventory report data for 2019; representing per capita CO2e emissions of 21 tons, three times the global average. Coal was responsible for 30% of emissions. The national Greenhouse Gas Inventory estimates for the year to March 2021 were 494.2 million tonnes, which is 27.8 million tonnes, or 5.3%, lower than the previous year. It is 20.8% lower than in 2005. According to the government, the result reflects the decrease in transport emissions due to COVID-19 pandemic restrictions, reduced fugitive emissions, and reductions in emissions from electricity; however, there were increased greenhouse gas emissions from the land and agriculture sectors.

Renewable energy in Canada represented 17.3% of the Total Energy Supply (TES) in 2020, following natural gas at 39.1% and oil at 32.7% of the TES.
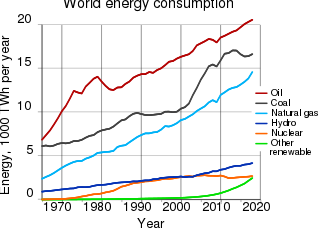
The environmental impact of the energy industry is significant, as energy and natural resource consumption are closely related. Producing, transporting, or consuming energy all have an environmental impact. Energy has been harnessed by human beings for millennia. Initially it was with the use of fire for light, heat, cooking and for safety, and its use can be traced back at least 1.9 million years. In recent years there has been a trend towards the increased commercialization of various renewable energy sources. Scientific consensus on some of the main human activities that contribute to global warming are considered to be increasing concentrations of greenhouse gases, causing a warming effect, global changes to land surface, such as deforestation, for a warming effect, increasing concentrations of aerosols, mainly for a cooling effect.
Seafood in Australia comes from local and international commercial fisheries, aquaculture and recreational anglers. It is an economically important sector, and along with agriculture and forestry contributed $24,744 million to Australia's GDP in year 2007–2008, out of a total GDP of $1,084,146 million. Commercial fisheries in Commonwealth waters are managed by the Australian Fisheries Management Authority, while commercial and recreational fishing in state waters is managed by various state-level agencies.

Climate change in Scotland is causing a range of impacts on Scotland, and its mitigation and adaptation is a matter for the devolved Scottish Parliament. Climate change has already changed timings of spring events such as leaf unfolding, bird migration and egg-laying. Severe effects are likely to occur on biodiversity.

Ireland is a net energy importer. Ireland's import dependency decreased to 85% in 2014. The cost of all energy imports to Ireland was approximately €5.7 billion, down from €6.5 billion (revised) in 2013 due mainly to falling oil and, to a lesser extent, gas import prices. Consumption of all fuels fell in 2014 with the exception of peat, renewables and non-renewable wastes.
The desert-covered Kingdom of Saudi Arabia is the geographically largest country in the Middle East. Moreover, it accounts for 65% of the overall population of the GCC countries and 42% of its GDP. Saudi Arabia does not have a strong history in environmentalism. Thus, as the number of population increases and the industrial activity grows, environmental issues pose a real challenge to the country.