Economic geography of the United Kingdom

Last updated

The economic geography of the United Kingdom reflects its high position in the current economic league tables, as well as reflecting its long history as a trading nation and as an imperial power. This in turn was built on exploitation of natural resources such as coal and iron ore.

Contents

Much has changed since Bevan's speech (below) in 1945, with the coalfields largely deserted and the Empire relinquished. With its dominant position gone, the UK economic geography is increasingly shaped by the one constant: it is a trading nation.

"This island is made mainly of coal and surrounded by fish. Only an organising genius could produce a shortage of coal and fish at the same time."
Aneurin Bevan, From a speech in Blackpool, 25 May 1945

Regions

Between 1998 and 2024, the UK economy grew by 41%, with the economies of Scotland (38%), Wales (40%) and Northern Ireland (38%) growing at varying rates. [1]

The GDP of each area of the UK varies tremendously, with London having 10 times the GDP of Northern Ireland in 2022; [2] while London and the South East of England made up over a third of the national GDP, Northern Ireland, Wales and the North East of England combined made up less than a sixth.

The GDP per capita showed similar variations with London having a GDP per head of £56,000 compared with the North East of England at £23,000 in 2024. [3]

Different regions also see different rates of unemployment; in early 2024, the average UK unemployment rate was 4.3%, ranging from the East Midlands at 5.6% to Northern Ireland at 2.1%. [3]

Agriculture, fossil fuels and manufacturing

Agriculture

The UK has rarely been self-sufficient in terms of food supply. In 2023, the country was 54–60% self-sufficient in food. [4] [5] In 2022, the country produced enough sheep and milk to be self-sufficient, and almost enough poultry, eggs and cereals, but other foods, such as rice, tomatoes and exotic fruits, had to be imported. [6] Its modern pattern of agriculture reflects a combination of history, current public policy and comparative advantage.

Since the Enclosure Acts of the eighteenth century, the UK's uplands (including Wales and the Scottish Highlands) have largely been associated with animal husbandry and forestry. However, by the time of the Enclosure Acts, most of lowland Britain was already enclosed by processes such as assarting or illegal, but tolerated, piecemeal enclosure. However, evidence of the former open field system of agriculture can still be seen in some parts of the landscape, such as in the indentations remaining from boundary ditches of the former farming strips. Enclosure, in turn, led to intensification.

Most UK agriculture is intensive and highly mechanised, with the use of chemical fertilisers and insecticides routine. By European standards it is very efficient, although that does not necessarily make it profitable. This intense nature was compounded in the post-War years, with fields being expanded at the expense of hedgerows. This process has been heavily criticised for damaging biodiversity.

East Anglia and South East England have been centres for grain production, with some areas of South East England also specialising in market gardening. The county of Kent was so well known for this that it is often referred to as the Garden of England and was particularly noted for hop growing. Dairy farming is most prevalent in South West England.

Northern Ireland is self-sufficient in food production and is able to export more than half of its meat and crops to the rest of the UK and beyond. [7] [8]

The detailed pattern of modern UK agriculture was heavily influenced by the Common Agricultural Policy of the European Union, with a combination of price support and set-aside policy.

Around the edges of south eastern towns, perfectly good agricultural land often remains uncultivated as a result of price distortions created by the Metropolitan Green Belt. Indeed, since around 2001 speculators have been buying Green Belt agricultural land, generally adjacent to built up areas, and selling it off in plots, persuading buyers that the government will have to weaken Green Belt protection to solve the housing crisis (see below). It is hard to see when such plots could come back into production.

Fossil fuels

The UK's industry sector was once dominated by the coal; heavily concentrated in south Wales, north and south Staffordshire, Leicestershire and Derbyshire, South Yorkshire, Northumberland, County Durham, Fife and Midlothian. The number of pits and miners have been slashed, and output fell by more than 75% between 1981 and 2003. The remaining pits produced 17.2 million tonnes of oil equivalent in 2003, making the UK the 15th largest coal producing nation, compared with 4th in 1981, according to the BP Statistical Review of World Energy 2004. In 2021, the country had seven coal mines in operation, employing just over 6,000 people. [9]

The major primary fossil fuel industry in the UK is North Sea oil. Its activity is concentrated on the east coast in Scotland and Northern England. The waters in the North Sea off the east coast of Scotland contain nearly half of the UK's remaining oil reserves, and a quarter of reserves are located in the North Sea near the Shetland Islands. As of January 2004, the UK had proven crude oil reserves of 4.7 billion barrels (750,000,000 m³) including onshore reserves, according to the Oil and Gas Journal. However, the number of people employed in this industry dropped dramatically during the 2010s. [10]

A closely related industry is natural gas which, since the 1970s, has supplied all of the UK gas needs, replacing poisonous coal, or town, gas. Most natural gas production is in the North Sea, with a small amount onshore and in the Irish Sea. The largest reserves not related to oil production are in the southern North Sea between the UK and the Netherlands, although; the largest reserves, are associated with oil production. The UK has been a net natural gas importer since 2010. [11] [12]

Manufacturing

Manufacturing employment by region [13] [14]
Region2000%2021%% Δ
Eastern333,78115.0194,23810.2-41.8
East Midlands383,36022.1225,38811.8-41.0
London287,2117.1121,1316.4-57.8
North East175,56918.292,2204.8−47.5
North West499,02017.6254,84013.4−48.9
Northern Irelandn/an/an/an/a
Scotland302,47313.6n/an/a
South East436,75312.0244,80012.8−44.0
South West302,28815.0184,4829.7−39.0
Wales200,95118.6112,2745.9−44.1
West Midlands494,79821.6261,05113.7−47.2
Yorkshire and the Humber383,64118.4216,07411.3−43.7
Total3,496,0121,906,498-45.5


Northern Ireland – In 2022, manufacturing jobs employed 88,000 people, or 11% of the workers in the region. [15]


At one time or another virtually every product that can be imagined has been made in the UK. In particular its heavy manufacturing drove the industrial revolution, starting with the first blast furnace at Coalbrookdale in Shropshire.

A map of the major UK cities gives a good picture of where manufacturing flourished, and often specialisations could be identified, in particular:

The automotive industry can be traced back to the 1890s (growing after World War I), by which time industries such as shipbuilding, textiles and steel were already established.

In the inter-War years modern industries emerged, with aerospace forming clusters around London, Bristol and in Hertfordshire. The Hertfordshire cluster no longer exists. The early electronics industry generally preferred the south, especially the home counties.

Today there is no heavy manufacturing industry in which UK-based firms can be considered world leaders and no product in which a UK city or region is the world leader. [16]

However, the Midlands, in particular, remains a strong manufacturing centre, with around a fifth of employment dependent on manufacturing, and the East Midlands Development Agency has a policy to maintaining this characteristic.

More recently, high technology firms have concentrated largely along the M4 motorway, partly because of access to London Heathrow Airport, but also because of the economies of agglomeration. However, the general pattern remains that the south has lower, and falling, reliance on manufacturing.

Finance and services

Leeds' Central Business District Leeds CBD at night.jpg
Leeds' Central Business District

Once, every great city had a stock exchange. Now, the UK financial industry is concentrated overwhelmingly in the City of London and Canary Wharf, with back office and administrative operation often dispersed around the south of England.

London is one of the world's great financial centres, which is one of the factors that is commonly considered to make it a world city. Central London contains some of the most expensive commercial property in the world because of this.

From around the early 1990s London has been able to boast of having more U.S. banks than New York, as well as being host to branches of more than five hundred overseas banks. It is the principal financial centre of the world, ranked alongside New York and Tokyo as one of three where any serious financial player must be represented.

The City of London has around 300,000 employees, largely concentrated in the financial and professional sectors.

Within London, the desire for banks to be there put pressure on the City of London's ability to accommodate them. In the mid-1980s a crisis point was reached and, although the city was able to expand its stock of modern office space, this did not happen before Canary Wharf had been set up as a competitor. The irony is that Canary Wharf was built in the London Docklands that had, until 1970, been among the largest docks in the world. All manner of goods had been shipped from the factories of east London to the world; between 1961 and 1993 manufacturing employment in London fell from 1.6 million to 328,000. [17]

During the mid-1990s, Leeds took advantage of the internet's arrival as part of the .com boom. It became the UK's first city to have full broadband and digital coverage, making it a very attractive place for corporations to expand, particularly when opening call centres. During the changing 1990s, Leeds had better connections to London than any other UK city, being 2 hours from London by train. As a result, it is now the UK's 2nd largest financial and legal centre, [18] [19] [20] [21] [22] and the UK's largest e-business sector with more than 1/3 of the UK's internet traffic passing through the city. [23]

In this respect, Canary Wharf and Leeds are arguably more symbolic of the changed economic geography of the UK than any other place.

Edinburgh is the 2nd financial capital of the UK.

2020s

In 2021, there were 2.3 million people employed in financial services in the UK; financial centres included Edinburgh, Glasgow, Cardiff, Belfast, London and several cities in England. [24] The country was also the world’s leading net explorer of financial services in 2020.

By 2023, there were 2.5 million people employed in the industry, making up 12% of the UK economic output. [25]


Canary Wharf, London Canary Wharf Skyline 2, London UK - Oct 2012.jpg
Canary Wharf, London


See also

Related Research Articles

<span class="mw-page-title-main">Economy of Alberta</span>

The economy of Alberta is the sum of all economic activity in Alberta, Canada's fourth largest province by population. Alberta's GDP in 2018 was CDN$338.2 billion.

<span class="mw-page-title-main">Economy of Ethiopia</span>

The economy of Ethiopia is a mixed and transition economy with a large public sector. The government of Ethiopia is in the process of privatizing many of the state-owned businesses and moving toward a market economy. The banking, telecommunication and transportation sectors of the economy are dominated by government-owned companies.

<span class="mw-page-title-main">Economy of Indonesia</span>

The economy of Indonesia is a mixed economy with dirigiste characteristics, and it is one of the emerging market economies in the world and the largest in Southeast Asia. As an upper-middle income country and member of the G20, Indonesia is classified as a newly industrialized country. Estimated at over 21 quadrillion rupiah in 2023, it is the 16th largest economy in the world by nominal GDP and the 7th largest in terms of GDP (PPP). Indonesia's internet economy reached US$77 billion in 2022, and is expected to cross the US$130 billion mark by 2025. Indonesia depends on the domestic market and government budget spending and its ownership of state-owned enterprises. The administration of prices of a range of basic goods also plays a significant role in Indonesia's market economy. However, since the 1990s, the majority of the economy has been controlled by individual Indonesians and foreign companies.

<span class="mw-page-title-main">Economy of Pakistan</span>

The economy of Pakistan is categorized as a developing economy. It ranks as the 24th-largest based on GDP using purchasing power parity (PPP) and the 46th largest in terms of nominal GDP. With a population of 241.5 million people as of 2023, Pakistan's position at per capita income ranks 161st by GDP (nominal) and 138th by GDP (PPP) according to the International Monetary Fund (IMF).

<span class="mw-page-title-main">Geography of the United Kingdom</span>

The United Kingdom is a sovereign state located off the north-western coast of continental Europe. With a total area of approximately 244,376 square kilometres (94,354 sq mi), the UK occupies the major part of the British Isles archipelago and includes the island of Great Britain, the north-eastern one-sixth of the island of Ireland and many smaller surrounding islands. It is the world's 7th largest island country. The mainland areas lie between latitudes 49°N and 59°N, and longitudes 8°W to 2°E. The Royal Observatory, Greenwich, in south-east London, is the defining point of the Prime Meridian.

<span class="mw-page-title-main">Economy of the United Kingdom</span>

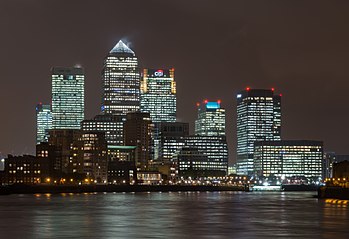
The economy of the United Kingdom is a highly developed social market economy. It is the sixth-largest national economy in the world measured by nominal gross domestic product (GDP), Tenth-largest by purchasing power parity (PPP), and twenty-first by nominal GDP per capita, constituting 3.1% of nominal world GDP. The United Kingdom constitutes 2.3% of world GDP by purchasing power parity (PPP).

<span class="mw-page-title-main">Economy of Mozambique</span>

The economy of Mozambique is $14.396 billion by gross domestic product as of 2018, and has developed since the end of the Mozambican Civil War (1977–1992). In 1987, the government embarked on a series of macroeconomic reforms, which were designed to stabilize the economy. These steps, combined with donor assistance and with political stability since the multi-party elections in 1994, have led to dramatic improvements in the country's growth rate. Inflation was brought to single digits during the late 1990s, although it returned to double digits in 2000–02. Fiscal reforms, including the introduction of a value-added tax and reform of the customs service, have improved the government's revenue collection abilities.

<span class="mw-page-title-main">Economy of England</span>

The economy of England is the largest economy of the four countries of the United Kingdom. England's economy is one of the largest and most dynamic in the world, with an average GDP per capita of £37,852 in 2022.
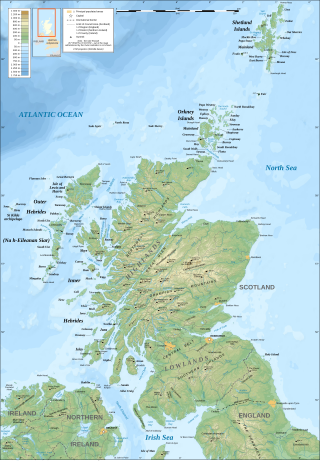
<span class="mw-page-title-main">Economy of Northern Ireland</span>

The economy of Northern Ireland is the smallest of the four constituents of the United Kingdom and the smaller of the two jurisdictions on the island of Ireland. At the time of the Partition of Ireland in 1922, and for a period afterwards, Northern Ireland had a predominantly industrial economy, most notably in shipbuilding, rope manufacture and textiles, but most heavy industry has since been replaced by services. Northern Ireland's economy has strong links to the economies of the Republic of Ireland and Great Britain.

<span class="mw-page-title-main">Economy of Scotland</span>

The economy of Scotland is an open mixed economy, mainly services based, and the second largest economy of the four countries of the United Kingdom. It had an estimated nominal gross domestic product (GDP) of £218.0 billion in 2023, including oil and gas extraction in the country's continental shelf region. Since the Acts of Union 1707, Scotland's economy has been closely aligned with the economy of the rest of the United Kingdom (UK), and England has historically been its main trading partner. Scotland conducts the majority of its trade within the UK: in 2017, Scotland's exports totalled £81.4 billion, of which £48.9 billion (60%) was within the UK, £14.9 billion with the European Union (EU), and £17.6 billion with other parts of the world. Scotland’s imports meanwhile totalled £94.4 billion including intra-UK trade leaving Scotland with a trade deficit of £10.4 billion in 2017.

<span class="mw-page-title-main">Economy of Kolkata</span>

Kolkata is the prime business, commercial and financial hub of eastern India and the main hub of communication for the North East Indian states. Kolkata is the third largest city by GDP in India after Mumbai and Delhi, with a GDP of $160 billion (PPP). Kolkata is home to India's oldest, stock exchange company (bourse) – The Calcutta Stock Exchange. Kolkata is home to many industrial units operated by large public- and private-sector corporations; major sectors include Steel, Heavy engineering, Mining, Minerals, cement, pharmaceuticals, Food processing, Agriculture, electronics, textiles, and jute.

<span class="mw-page-title-main">Economy of Leeds</span>

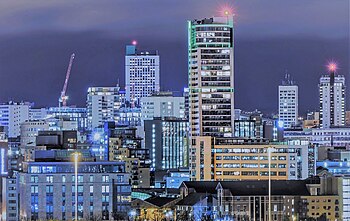
The economy of Leeds is the most diverse economy of all the UK's main employment centres and has seen the fastest rate of private-sector jobs growth of any UK city and has the highest ratio of public to private sector jobs of all the UK's Core Cities. Leeds has the third-largest jobs total by local authority area with 480,000 in employment and self-employment at the beginning of 2015.

<span class="mw-page-title-main">Industry of Bulgaria</span>

Bulgaria is an industrialized nation with a developed heavy and light manufacturing industry. In 2007 industry accounted for 31.7% of the country's GDP. This makes industry the second-largest sector of the economy after services. In 2007, the sector employed 33.6% of the labour force.

<span class="mw-page-title-main">Economy of Antigua and Barbuda</span>

The economy of Antigua and Barbuda is service-based, with tourism and government services representing the key sources of employment and income. Tourism accounts directly or indirectly for more than half of GDP and is also the principal earner of foreign exchange in Antigua and Barbuda. However, a series of violent hurricanes since 1995 resulted in serious damage to tourist infrastructure and periods of sharp reductions in visitor numbers. In 1999 the budding offshore financial sector was seriously hurt by financial sanctions imposed by the United States and United Kingdom as a result of the loosening of its money-laundering controls. The government has made efforts to comply with international demands in order to get the sanctions lifted. The dual island nation's agricultural production is mainly directed to the domestic market; the sector is constrained by the limited water supply and labor shortages that reflect the pull of higher wages in tourism and construction. Manufacturing comprises enclave-type assembly for export with major products being bedding, handicrafts, and electronic components. Prospects for economic growth in the medium term will continue to depend on income growth in the industrialized world, especially in the US, which accounts for about one-third of all tourist arrivals. Estimated overall economic growth for 2000 was 2.5%. Inflation has trended down going from above 2 percent in the 1995-99 period and estimated at 0 percent in 2000.

Pakistan's industrial sector accounts for 28.11% of the GDP. Of this, manufacturing makes up 12.52%, mining constitutes 2.18%, construction makes up 2.05%, and electricity and gas 1.36%. The majority of industry is made up of textile units, with textiles contributing $15.4b to exports, making up 56% of total exports. Other units include surgical instruments, chemicals, and a budding automotive industry. Pakistan's inadequately developed labor market, unable to absorb the increasing number of educated workers, has resulted in a high rate of unemployment among graduates.

<span class="mw-page-title-main">Outline of England</span> Overview of and topical guide to England

The following outline is provided as an overview of and topical guide to England:

The United Kingdom, where the Industrial Revolution began in the late 18th century, has a long history of manufacturing, which contributed to Britain's early economic growth. During the second half of the 20th century, there was a steady decline in the importance of manufacturing and the economy of the United Kingdom shifted toward services. Manufacturing, however, remains important for overseas trade and accounted for 44% of goods exports in 2014. In June 2010, manufacturing in the United Kingdom accounted for 8.2% of the workforce and 12% of the country's national output. The East Midlands and West Midlands were the regions with the highest proportion of employees in manufacturing. London had the lowest at 2.8%.

<span class="mw-page-title-main">Economy of the Western Cape</span>

The economy of the Western Cape in South Africa is dominated by the city of Cape Town, which accounted for 72% of the Western Cape's economic activity in 2016. The single largest contributor to the region's economy is the financial and business services sector, followed by manufacturing. Close to 30% of the gross regional product comes from foreign trade with agricultural products and wine dominating exports. High-tech industries, international call centres, fashion design, advertising and TV production are niche industries rapidly gaining in importance.

<span class="mw-page-title-main">Economic history of the United Kingdom</span>

The economic history of the United Kingdom relates the economic development in the British state from the absorption of Wales into the Kingdom of England after 1535 to the modern United Kingdom of Great Britain and Northern Ireland of the early 21st century.

<span class="mw-page-title-main">History of industrialisation</span>

This article delineates the history of industrialisation.

References

  1. Northern Ireland Assembly website, Northern Ireland Economic Overview, published 1 March 2024
  2. Statista.com website, Gross Domestic Product of the United Kingdom in 2022, by region
  3. 1 2 Statista.com website, Unemployment rate in the UK 2024, by region, article by D Clark dated 15 May 2024
  4. The Scottish Farmer website, NFU concerns with UK’s food self-sufficiency, article dated 9 August 2023
  5. Belfast Telegraph website, Local Food Production ‘should be priority’ in Northern Ireland in bid to lower emissions, article by David Brown and Pavel Barter dated 9 June 2023
  6. UK Government website, UK Food Security Index 2024, article published 14 May 2024
  7. Fact Check NI website, Does Northern Ireland produce enough to feed 10 million people?, article dated 16 November 2021
  8. Beacom, Emma; Furey, Sinéad; Hollywood, Lynsey; Humphreys, Paul (25 April 2021). "Conceptualising household food insecurity in Northern Ireland: Risk factors, implications for society and the economy, and recommendations for business and policy response". Sn Business & Economics. 1 (5): 67. doi:10.1007/s43546-021-00070-9. PMC   8074353 . PMID   34778828.
  9. Statista.com website, Number of people employed in the coal mining industry in the United Kingdom (UK) from 1920 to 2022
  10. Statista.com website, Number of people employed in the offshore oil and gas industry in the United Kingdom (UK) from 2013 to 2019
  11. Statista.com website, Net imports of natural gas in the United Kingdom (UK) from 2010 to 2022
  12. Office for Budget Responsibility website, A History of Natural Gas in the UK, July 2023
  13. ONS Annual Business Inquiry
  14. "Industry – Office for National Statistics". www.ons.gov.uk. Retrieved 29 March 2023.
  15. Northern Ireland Government website, Business Register and Employment Survey 2022
  16. UK Government website, Research Briefings section, Manufacturing: international comparisons, 5 January 2018 (page 3)
  17. "Exploring 20th century London: Work". Museum of London. Retrieved 15 October 2011.
  18. "Quality of Law – Quality of Advice". Leeds Legal. Archived from the original on 6 October 2011. Retrieved 17 October 2011.
  19. Archived 9 December 2008 at the Wayback Machine
  20. "A-Z of universities: Leeds – Education News, Education". The Independent. UK. 2 October 1997. Retrieved 17 October 2011.
  21. "Invest in financial services in Yorkshire & Humber". Yorkshire Forward. Retrieved 17 October 2011.
  22. "Leeds key to the UK's lead in financial services". Cityoflondon.gov.uk. 25 July 2007. Archived from the original on 21 February 2012. Retrieved 17 October 2011.
  23. "Cable broadband, TV & phone plus mobile broadband & phone". Virgin Media. 25 March 2010. Retrieved 17 October 2011.[ permanent dead link ]
  24. UK Government website, Financial Services
  25. UK Government website, State of the sector: annual review of UK financial services 2023

References and further reading