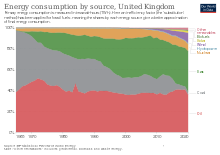
Total energy consumption in the United Kingdom was 142.0milliontonnes of oil equivalent (1,651TWh) in 2019.[2] In 2014, the UK had an energy consumptionper capita of 2.78tonnes of oil equivalent (32.3MWh) compared to a world average of 1.92tonnes of oil equivalent (22.3MWh).[3] Demand for electricity in 2023 was 29.6GW on average (259TWh over the year), supplied through 235TWh of UK-based generation and 24TWh of energy imports.[4]
Successive UK governments have outlined numerous commitments to reduce carbon dioxide emissions. One such announcement was the Low Carbon Transition Plan launched by the Brown ministry in July 2009, which aimed to generate 30% electricity from renewable sources, and 40% from low-carbon content fuels by 2020. Notably, the UK is one of the best sites in Europe for wind energy, and wind power production is its fastest growing supply.[5][6][7] Wind power contributed 29.4% of UK electricity generation in 2023.[8]
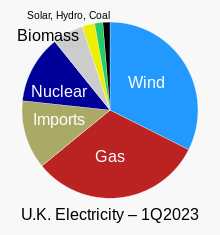
The electricity sector's grid supply for the United Kingdom in 2023 came from 33% fossil fuel power (almost all from natural gas), 50.3% zero-carbon power (including 14.2% nuclear power and 36.1% from wind, solar and hydroelectricity), 5% from biomass, 10.7% imports, and 1% from storage.[8]
Government commitments to reduce emissions are occurring against a backdrop of economic crisis across Europe.[9] During the European financial crisis, Europe's consumption of electricity shrank by 5%, with primary production also facing a noticeable decline. Britain's trade deficit was reduced by 8% due to substantial cuts in energy imports.[10] Between 2007 and 2015, the UK's peak electrical demand fell from 61.5GW to 52.7. By 2022 it reached 47.1 GW.[11][12][13]
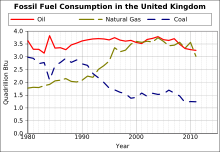
Fossil fuel consumption in the UK. Since the 1990s, coal use declined while natural gas use increased.
In 2022, the United Kingdom's total energy supply (TES) was primarily composed of natural gas, contributing 39.4%, followed by oil at 34.8%, nuclear power at 8.1%, and coal at 3.2%. Biofuels and waste contributed 8.9%, while other renewable sources such as wind, solar, and hydro collectively accounted for 5.6% of the energy mix.[15] Coal generation ceased in September 2024.[16]
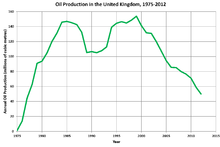
United Kingdom oil production 1975–2012 (data from DECC)Petroleum production and consumption in the United Kingdom
After UK oil production peaked at nearly 3 million barrels per day in 1999,[17] concerns over peak oil production were raised by high-profile voices in the United Kingdom such as David King[18] and the Industry Task-Force on Peak Oil and Energy Security.[19] The latter's 2010 report states that "The next five years will see us face another crunch – the oil crunch. This time, we do have the chance to prepare. The challenge is to use that time well." (Richard Branson and Ian Marchant).[20] However, world peak oil production was not reached and instead the debate is about oil imports and when peak oil demand will be reached.[21]
In 2021, oil products in the United Kingdom were primarily consumed by the transport sector, constituting 72.7% of usage. The industry sector used 5.2% of oil products, while residential and commercial/public services sectors each accounted for 4.7% and 4.5%, respectively. Agriculture and forestry accounted for 1.5%, with fishing making up a minimal share at 0.2%. Non-energy use represented 10.4% of the total oil product consumption.[22]
In October 2022, it was confirmed that UK Prime Minister, Liz Truss, would be issuing hundreds of new oil and gas licenses.[23] In the same month, Truss said she will not tax the profits of oil and gas corporations to pay for a freeze in energy bills.[24]
United Kingdom produced 60% of its consumed natural gas in 2010. In five years the United Kingdom moved from almost gas self-sufficient (see North Sea gas) to 40% gas import in 2010. Gas was almost 40% of total primary energy supply (TPES) and electricity more than 45% in 2010. Underground storage was about 5% of annual demand and more than 10% of net imports. There is an alternative fuel obligation in the United Kingdom.[25] (see Renewable Transport Fuel Obligation)
A gas leak occurred in March 2012 at the Elgin-Franklin fields, where about 200,000cubicmetres of gas was escaping every day. Total missed out on about £83million of potential income.[26]
In 2022, gas consumption in the United Kingdom was primarily attributed to the residential sector, which accounted for 73.1% of usage, while the commercial and public services sectors utilized 22.6%. Non-energy use represented 1.2% of the total gas consumption.[27]
Coal
In 2021, coal consumption in the United Kingdom was primarily driven by the industrial sector, accounting for 72.9% of usage. Residential consumption followed at 23.3%, while commercial and public services sectors accounted for 0.9%. Non-energy use represented 2.2% of the total coal consumption.[28]
As of 30September2024[update], there is no coal power generation in the United Kingdom.[16] Coal power in England and Wales reduced substantially in the beginning of the twenty-first century. The power stations known as the Hinton Heavies closed, and by the 2020s coal was rarely used for power generation.[29]
Electricity production from coal in 2018 was less than any time since the industrial revolution, with the first "coal free day" in 2017 and the first coal free week in 2019.[30] Coal supplied 5.4% of UK electricity in 2018, down from 7% in 2017, 9% in 2016, 23% in 2015 and 30% in 2014.[31] The UK Government announced in November 2015 that all the remaining 14 coal-fired power stations would be closed by 2025.[32] In February 2020, the government said that it would consult on bringing the closure date forward to 2024.[33][34]
On 30 September 2024, the final coal fired power station, Ratcliffe-on-Soar, closed bringing an end to the UK's use of coal to produce electricity.[16]
Britain's fleet of operational reactors consists of ten Advanced Gas-cooled Reactors at four discrete sites and one pressurised water reactor unit at Sizewell B. The total installed nuclear capacity in the United Kingdom is about 6.8GW.[35] In addition, the UK experimented with fast breeder reactor technologies at Dounreay in Scotland; however the last fast breeder (with 250MWe of capacity) was shut down in 1994.[36]
Even with changes to the planning system to speed nuclear power plant applications, there are doubts over whether the necessary timescale could be met to increase nuclear power output, and over the financial viability of nuclear power with present oil and gas prices. With no nuclear plants having been constructed since Sizewell B in 1995, there are also likely to be capacity issues within the native nuclear industry. The existing privatised nuclear supplier, British Energy, had been in financial trouble in 2004.
In October 2010, the coalition British Government gave the go-ahead for the construction of up to eight new nuclear power plants.[37] However, the Scottish Government, with the backing of the Scottish Parliament, has stated that no new nuclear power stations will be constructed in Scotland.[38][39]
In 2007, the United Kingdom Government agreed to an overall European Union target of generating 20% of the European Union's energy supply from renewable sources by 2020. Each European Union member state was given its own allocated target; for the United Kingdom it is 15%. This was formalised in January 2009 with the passage of the EU Renewables Directive. As renewable heat and fuel production in the United Kingdom are at extremely low bases, RenewableUK estimates that this will require 35–40% of the United Kingdom's electricity to be generated from renewable sources by that date,[40] to be met largely by 33–35GW of installed wind capacity.
In the third quarter of 2019, renewables contributed towards 38.9% of the UK's electricity generation, producing 28.8TWh of electricity.[41]
In June 2017, renewables plus nuclear generated more UK power than gas and coal together for the first time and new offshore wind power became cheaper than new nuclear power for the first time.[42]
In December 2007, the United Kingdom Government announced plans for a massive expansion of wind energy production, by conducting a Strategic Environmental Assessment of up to 25GW worth of wind farm offshore sites in preparation for a new round of development. These proposed sites were in addition to the 8GW worth of sites already awarded in the two earlier rounds of site allocations, Round 1 in 2001 and Round 2 in 2003. Taken together it was estimated that this would result in the construction of over 7,000 offshore wind turbines.[43]
Wind power delivers a growing fraction of the energy in the United Kingdom and at the beginning of November 2018, wind power in the United Kingdom consisted of nearly 10,000 wind turbines with a total installed capacity of just over 20 gigawatts: 12,254MW of onshore capacity and 7,897MW of offshore capacity.[44]
In August and September 2021, the UK had to restart coal plants, amidst a lack of wind, as power imports from Europe were insufficient to satisfy demand.[45][46]
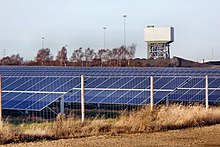
At the end of 2011, there were 230,000 solar power projects in the United Kingdom,[47] with a total installed generating capacity of 750MW.[48] By February 2012 the installed capacity had reached 1,000MW.[49]Solar power use has increased very rapidly in recent years, albeit from a small base, as a result of reductions in the cost of photovoltaic (PV) panels, and the introduction of a Feed-in tariff (FIT) subsidy in April 2010.[47] In 2012, the government said that 4million homes across the UK will be powered by the sun within eight years,[50] representing 22,000MW of installed solar power capacity by 2020.[47]
Gas from sewage and landfill (biogas) has already been exploited in some areas. In 2004 it provided 129.3GW·h (up 690% from 1990 levels), and was the UK's leading renewable energy source, representing 39.4% of all renewable energy produced (including hydro) in 2006.[51] The UK has committed to a target of 10.3% of renewable energy in transport to comply with the [Renewable Energy Directive of the European Union but has not yet implemented legislation to meet this target.[citation needed]
Other biofuels can provide a close-to-carbon-neutral energy source, if locally grown. In South America and Asia, the production of biofuels for export has in some cases resulted in significant ecological damage, including the clearing of rainforest. In 2004, biofuels provided 105.9GW·h, 38% of it wood. This represented an increase of 500% from 1990.[52]
The UK is importing large quantities of wood pellets from the United States, replacing coal at several generating stations.[53]
The Dinorwig Power Station lower reservoir, a 1,800MW pumped-storage hydroelectric scheme, in north Wales, and the largest hydroelectric power station in the UK
As of 2012, hydroelectric power stations in the United Kingdom accounted for 1.67GW of installed electrical generating capacity, being 1.9% of the UK's total generating capacity and 14% of UK's renewable energy generating capacity. Annual electricity production from such schemes is approximately 5,700GWh, being about 1.5% of the UK's total electricity production.[55]
There are also pumped-storage power stations in the UK. These power stations are net consumers of electrical energy however they contribute to balancing the grid, which can facilitate renewable generation elsewhere, for example by 'soaking up' surplus renewable output at off-peak times and release the energy when it is required.
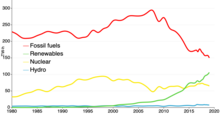
Electricity supplied (net) 1948 to 2008UK electricity production by source 1980–2018
History
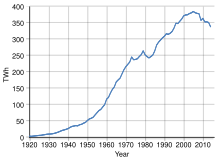
During the 1940s, some 90% of the electricity generation was by coal, with oil providing most of the remainder. With the development of the national grid, the switch to using electricity, United Kingdom electricity consumption increased by around 150% between the post-war nationalisation of the industry in 1948 and the mid-1960s. During the 1960s, growth slowed as the market became saturated. The United Kingdom is planning to reform its electricity market, see also Decarbonisation measures in proposed UK electricity market reform.
It plans to introduce a capacity mechanism and contracts for difference to encourage the building of new generation.
The United Kingdom started to develop nuclear power capacity in the 1950s, with Calder Hall nuclear power station being connected to the grid on 27 August 1956. Though the production of weapons-gradeplutonium was the main reason behind this power station, other civil stations followed, and 26% of the nation's electricity was generated from nuclear power at its peak in 1997.
Despite the flow of North Sea oil from the mid-1970s, electricity generation from oil remained relatively small and continued to decline.
Starting in 1993, and continuing through the 1990s, a combination of factors led to a so-called Dash for Gas, during which the use of coal was scaled back in favour of gas-fuelled generation. This was sparked by the privatisation of the National Coal Board, British Gas and the Central Electricity Generating Board; the introduction of laws facilitating competition within the energy markets; and the availability of cheap gas from the North Sea. In 1990, just 1.09% of all gas consumed in the country was used in electricity generation; by 2004 the figure was 30.25%.[61]
By 2004, coal use in power stations had fallen to 50.5milliontonnes, representing 82.4% of all coal used in 2004 (a fall of 43.6% compared to 1980 levels), though up slightly from its low in 1999.[61] On several occasions in May 2016, Britain burned no coal for electricity for the first time since 1882.[62][63] On 21 April 2017, Britain went a full day without using coal power for the first time since the Industrial Revolution, according to the National Grid.[64]
From the mid-1990s, new renewable energy sources began to contribute to the electricity generated, adding to a small hydroelectricity generating capacity.
Electricity generation
In the first three months of 2023, Britain's wind turbines generated more electricity (32.4%) than gas-fired power stations (31.7%) for the first time.
In 2020, total electricity production stood at 312TWh (down from a peak of 385TWh in 2005), generated from the following sources:[66]
A typical offshore oil/gas platform
Gas: 35.7% (was 0.05% in 1990)
Nuclear: 16.1% (19% in 1990)
Wind: 24.2% (0% in 1990), of which:
Onshore Wind: 11.1%
Offshore Wind: 13%
Coal: 1.8% (67% in 1991)
Bio-Energy: 12.6% (0% in 1990)
Solar: 4.2% (0% in 1990)
Hydroelectric: 2.2% (2.6% in 1990)
Oil and other: 3.3% (12% in 1990)
The UK energy policy had targeted a total contribution from renewable energy to achieve 10% by 2010, but it was not until 2012 that this figure was exceeded; renewable energy sources supplied 11.3% (41.3TWh) of the electricity generated in the United Kingdom in 2012.[67] The Scottish Government had a target of generating 17% to 18% of Scotland's electricity from renewables by 2010,[68] rising to 40% by 2020.[69]
Renewable electricity
In 2022, renewable sources contributed 41.9% to the United Kingdom's total electricity generation, marking a substantial 1,452% increase from 2000 to 2022. Renewable electricity generation is primarily driven by wind, solar, and hydroelectric sources. Wind power was the largest contributor, accounting for 79.1% of renewable electricity generation, followed by solar PV at 13.7%, and hydroelectric power at 7.2%.[70]
While in some ways limited by which powers are devolved, the four nations of the United Kingdom have different energy mixes and ambitions. Scotland currently has a target of 80% of electricity from renewables by 2020, which was increased from an original ambition of 50% by 2020 after it exceeded its interim target of 31 percent by 2011.[71] Scotland has most of the UK's hydro-electric power generation facilities. It has a quarter of the EU's estimated offshore wind potential,[72] and is at the forefront of testing various marine energy systems.[73]
Combined heat and power (CHP) plants, where 'waste' hot water from generating is used for district heating, are also a well tried technology in other parts of Europe. While it heats about 50% of all houses in Denmark, Finland, Poland, Sweden and Slovakia, it currently only plays a small role in the United Kingdom. It has, however, been rising, with total generation standing at 27.9TWh by 2008. This consisted of 1,439 predominantly gas-fired schemes with a total CHP electrical generating capacity of 5.47GW, and contributing 7% of the UK's electricity supply.[56] Heat generation utilisation has fallen however from a peak of 65TWh in 1991 to 49TWh in 2012.
Energy research
Historically, public sector support for energy research and development in the United Kingdom has been provided by a variety of public and private sector bodies.
The Engineering and Physical Sciences Research Council funds an energy programme[74] spanning energy and climate change research. It aims to "develop, embrace and exploit sustainable, low carbon and/or energy efficient technologies and systems" to enable the United Kingdom "to meet the Government's energy and environmental targets by 2020". Its research includes renewable, conventional, nuclear and fusion electricity supply as well as energy efficiency, fuel poverty and other topics.
Since being established in 2004, the UK Energy Research Centre[75] carries out research into demand reduction, future sources of energy, infrastructure and supply, energy systems, sustainability and materials for advanced energy systems.
The Energy Technologies Institute, set up to 'accelerate the development of secure, reliable and cost-effective low-carbon energy technologies towards commercial deployment', began its work in 2007 and is due to close at the end of 2019.[76]
In relation to buildings, the Building Research Establishment[77] carries out some research into energy conservation.
There is currently international research being conducted into fusion power. The ITER reactor is currently being constructed at Cadarache in France. The United Kingdom contributed towards this project through membership of the European Union. Prior to this, an experimental fusion reactor (the Joint European Torus) had been built at Culham in Oxfordshire.
The 1973 oil crisis resulted in the UK government taking a strategic role in managing energy demand. In early 1974 a new Department of Energy was established by Edward Heath's government and was retained under Harold Wilson's premiership following the February 1974 election. In December of that year, a new energy efficiency programme was launched, that included the 'Save It' advertising campaign.[78] In 1977 Tony Benn was appointed Energy Secretary and, in December 1977, a further four-year programme was announced including continuation of the Save It campaign. The Energy Survey Scheme, providing grants to industry for energy surveys, and the Energy Conservation Demonstration Scheme (EEDS), were introduced.[78]
In May 1979 the Conservatives under Margaret Thatcher were elected and with their commitment to the role of free markets, some of the Labour party's initiatives were wound down. EEDS however, in which government support was provided for research, development and demonstration, was well regarded and continued although monitoring of projects was considered expensive and there were commercial risks for which government met the bill.[79]
In 1982, the Armitage Norton Report for the Department of Energy promoted the idea of barriers to energy efficiency that might be overcome by information and awareness programmes that would improve the operation of markets. Following the re-election of the Conservatives in the 1983 General Election, Peter Walker was appointed Energy Secretary. He was regarded as an energy conservation enthusiast, while also presiding over a shift from energy conservation to energy efficiency - not 'doing without', but 'doing more with less'. He formed a new Energy Efficiency Office (EEO) in 1983, and 1986 was designed Energy Efficiency Year, with the 'Get More for Your Monergy' campaign.[78]
In 1987, the Conservatives secured a third term, and Cecil Parkinson became Energy Secretary. A free market enthusiast, he cut the budget of the EEO and constrained its initiatives, such as information and advice, that did not interfere with the operation of free markets. Nevertheless various initiatives were introduced over the following five years including the Making a Corporate Commitment Campaign (MACC), the Energy Design Advice Scheme (EDAS), and the Energy Management Assistance Scheme (EMAS).
The Energy Efficiency Best Practice programme (EEBPp) was among these. Its introduction corresponded with growing scientific concerns about global warming and a Cabinet seminar in 1989 where a strong case was presented in support of energy efficiency.[78] The UK went on to produce its first environmental White Paper 'This Common Inheritance' in 1990, and the budget for the EEO rose from £26m in 1990 to £59m in 1992.[78]
Scotland cut greenhouse gas emissions by around 46% between 1990 and 2014.[82] Scotland aims to have a carbon-free electricity sector based on renewable energy sources by 2032. Scotland also aims to repair 250,000 hectares (620,000 acres; 2,500km2) of degraded peatlands, which store a total of 1.7gigatonnes of CO2.[83]
Since 2013, an Energy Company Obligation (ECO) levy on electricity has been in effect. As of 2022, the levy generates around 1 billion pounds.[citation needed]
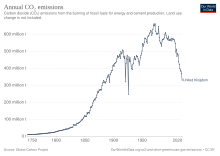
In 2022, the United Kingdom's CO2 emissions primarily originated from natural gas and oil, contributing 46.4% and 45.8%, respectively, to the total CO2 emissions from fuel combustion. Coal represented a smaller fraction, at 6.0%, while other sources constituted 1.8%.[84]
↑ J Rigby (2005) Policy, theory and pragmatism: implementing the UK's Energy Efficiency Best Practice programme, Policy & Politics, vol 33, no 2, pp 277-295
Companies with headquarters and/or registered office in the UK but no applicable energy operations within the country shown in italics1Ultimate parent company is not UK-based 2Integrated in the United States, no generation or supply activities in the UK
This page is based on this Wikipedia article Text is available under the CC BY-SA 4.0 license; additional terms may apply. Images, videos and audio are available under their respective licenses.