
Total energy consumption in the United Kingdom was 142.0 million tonnes of oil equivalent in 2019. In 2014, the UK had an energy consumption per capita of 2.78 tonnes of oil equivalent compared to a world average of 1.92 tonnes of oil equivalent. Demand for electricity in 2023 was 29.6 GW on average, supplied through 235 TWh of UK-based generation and 24 TWh of energy imports.

Denmark has considerable sources of oil and natural gas in the North Sea and ranked as number 32 in the world among net exporters of crude oil in 2008. Denmark expects to be self-sufficient with oil until 2050. However, gas resources are expected to decline, and production may decline below consumption in 2020, making imports necessary. Denmark imports around 12% of its energy.
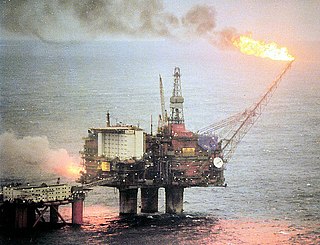
Norway is a large energy producer, and one of the world's largest exporters of oil. Most of the electricity in the country is produced by hydroelectricity. Norway is one of the leading countries in the electrification of its transport sector, with the largest fleet of electric vehicles per capita in the world.

China is both the world's largest energy consumer and the largest industrial country, and ensuring adequate energy supply to sustain economic growth has been a core concern of the Chinese Government since the founding of the People's Republic of China in 1949. Since the country's industrialization in the 1960s, China is currently the world's largest emitter of greenhouse gases, and coal in China is a major cause of global warming. China is also the world's largest renewable energy producer, and the largest producer of hydroelectricity, solar power and wind power in the world. The energy policy of China is connected to its industrial policy, where the goals of China's industrial production dictate its energy demand managements.

Energy in Finland describes energy and electricity production, consumption and import in Finland. Energy policy of Finland describes the politics of Finland related to energy. Electricity sector in Finland is the main article regarding electricity in Finland.

Energy in Switzerland is transitioning towards sustainability, targeting net zero emissions by 2050 and a 50% reduction in greenhouse gas emissions by 2030.

The total electricity consumption of the Netherlands in 2021 was 117 terawatt-hours (TWh). The consumption grew from 7 TWh in 1950 by an average of 4.5% per year. In 2021, fossil fuels, such as natural gas and coal, accounted for around 62% of the total electricity produced. Renewable energy sources, such as biomass, wind power, and solar power, produce 38% of the total electricity. One nuclear plant in Borssele is responsible for around 3% of total generation. More than 75% of electricity is produced centrally by thermal and nuclear units.

The electricity sector in Switzerland relies mainly on hydroelectricity, since the Alps cover almost two-thirds of the country's land mass, providing many large mountain lakes and artificial reservoirs suited for hydro power. In addition, the water masses drained from the Swiss Alps are intensively used by run-of-the-river hydroelectricity (ROR). With 9,052 kWh per person in 2008, the country's electricity consumption is relatively high and was 22% above the European Union's average.

Electricity sector in Luxembourg describes electricity issues in Luxembourg. Luxembourg is a member of OECD and European Union. Luxembourg imports most of its energy. Luxembourg is the EU country with the second smallest forecast of renewables in 2020. Luxembourg has one of the highest emissions of carbon dioxide per person in Europe.

South Africa has a large energy sector, being the third-largest economy in Africa. The country consumed 227 TWh of electricity in 2018. The vast majority of South Africa's electricity was produced from coal, with the fuel responsible for 88% of production in 2017. South Africa is the 7th largest coal producer in the world. As of July 2018, South Africa had a coal power generation capacity of 39 gigawatts (GW). South Africa is the world's 14th largest emitter of greenhouse gases. South Africa is planning to shift away from coal in the electricity sector and the country produces the most solar and wind energy by terawatt-hours in Africa. The country aims to decommission 34 GW of coal-fired power capacity by 2050. It also aims to build at least 20 GW of renewable power generation capacity by 2030. South Africa aims to generate 77,834 megawatts (MW) of electricity by 2030, with new capacity coming significantly from renewable sources to meet emission reduction targets. Through its goals stated in the Integrated Resource Plan, it announced the Renewable Energy Independent Power Producer Procurement Programme, which aims to increase renewable power generation through private sector investment.
Energy in Kuwait describes energy and electricity production, consumption, import and export in Kuwait.
Energy in Algeria encompasses the production, consumption, and import of energy. As of 2009, the primary energy use in Algeria was 462 TWh, with a per capita consumption of 13 TWh. Algeria is a significant producer and exporter of oil and gas and has been a member of the Organization of the Petroleum Exporting Countries (OPEC) since 1969. It also participates in the OPEC+ agreement, collaborating with non-OPEC oil-producing nations. Historically, the country has relied heavily on fossil fuels, which are heavily subsidized and constitute the majority of its energy consumption. In response to global energy trends, Algeria updated its Renewable Energy and Energy Efficiency Development Plan in 2015, aiming for significant advancements by 2030. This plan promotes the deployment of large-scale renewable technologies, such as solar photovoltaic systems and onshore wind installations, supported by various incentive measures.

Energy policy of Belgium describes the politics of Belgium related to energy. Energy in Belgium describes energy and electricity production. consumption and import in Belgium. Electricity sector in Belgium is the main article of electricity in Belgium.

Energy in Sweden is characterized by relatively high per capita production and consumption, and a reliance on imports for fossil fuel supplies.
Energy in the Czech Republic describes energy and electricity production, consumption and import in the Czech Republic.

Energy in Portugal describes energy and electricity production, consumption and import in Portugal. Energy policy of Portugal will describe the politics of Portugal related to energy more in detail. Electricity sector in Portugal is the main article of electricity in Portugal.
Electricity in Cyprus is managed by the Electricity Authority of Cyprus. Power is primarily generated at three fuel oil-burning stations but the use of distributed renewable energy is expanding.

Primary energy use in Slovakia was 194 TWh and 36 TWh per million inhabitants in 2009.

Coal in Europe is a term describing the use of coal as an energy source in Europe, including both thermal coal used for power generation and coking coal used for steel production.

World energy supply and consumption refers to the global supply of energy resources and its consumption. The system of global energy supply consists of the energy development, refinement, and trade of energy. Energy supplies may exist in various forms such as raw resources or more processed and refined forms of energy. The raw energy resources include for example coal, unprocessed oil & gas, uranium. In comparison, the refined forms of energy include for example refined oil that becomes fuel and electricity. Energy resources may be used in various different ways, depending on the specific resource, and intended end use. Energy production and consumption play a significant role in the global economy. It is needed in industry and global transportation. The total energy supply chain, from production to final consumption, involves many activities that cause a loss of useful energy.
