2001 United Kingdom general election in England Last updated December 26, 2025
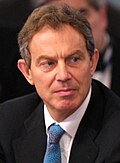
2001 United Kingdom general election in England First party Second party Third party Leader Tony Blair William Hague Charles Kennedy Party Labour Conservative Liberal Democrats Leader since 21 July 1994 19 June 1997 9 August 1999 Leader's seat Sedgefield Richmond (Yorks) Ross, Skye & Inverness West Last election 328 seats, 43.5% 165 seats, 33.7% 34 seats, 17.9% Seats won 323 165 40 Seat change Popular vote 9,056,824 7,705,870 4,246,853 Percentage 41.4% 35.2% 19.4% Swing
The 2001 United Kingdom general election in England was held on 7 June 2001 for 529 English seats to the House of Commons. The Labour Party won a landslide majority of English seats for the second election in a row. [ 1]
Much like the results in the rest of the United Kingdom, the results in England largely mirrored the results of the 1997 election. Labour lost only five seats in England and the Conservatives remained unchanged (losing eight seats but gaining eight). However, three of the few new MPs elected were future Conservative Prime Ministers David Cameron and Boris Johnson and future Conservative Chancellor of the Exchequer George Osborne . The party also gained back Tatton which it lost in 1997 to independent Martin Bell . Bell, however, did not contest the seat, and unsuccessfully ran as an independent candidate in Brentwood and Ongar .
The Liberal Democrats gained six seats overall, all of which were in England. The party gained five from Labour and one from the Conservatives.
Richard Taylor of Independent Kidderminster Hospital and Health Concern (also known simply as "Health Concern") secured his first election win, taking Wyre Forest from government MP, David Lock .
Results Party Seats Aggregate votes Total Gains Losses Net Of all (%) Total Of all (%) Difference Labour 323 2 7 61.1 9,056,824 41.4 Conservative 165 7 7 31.2 7,705,870 35.2 Liberal Democrats 40 8 2 8.1 4,246,853 19.4 UKIP 0 0 0 0.0 374,775 1.7 Green 0 0 0 0.0 158,173 0.7 Independent 0 0 1 0.0 79,559 0.4 Socialist Alliance 0 0 0 0.0 55,295 0.3 N/A Socialist Labour 0 0 0 0.0 51,299 0.2 BNP 0 0 0 0.0 46,851 0.2 Health Concern 1 1 0 0.2 28,487 0.1 New Liberal 0 0 0 0.0 13,302 0.1 Others 0 0 0 0.0 53,474 0.2 N/A Total 529 21,870,762 59.1
Popular vote Labour
41.4% Conservative
35.2% Liberal Democrats
19.4% UKIP
1.7% Green
0.7% Other
1.5%
Parliament seats Labour
61.1% Conservative
31.2% Liberal Democrats
7.6% Other
0.2%
Regional results Note: the below regional vote shares, seats and changes are sourced from the BBC. [ 1] The regions referenced do not exactly match the statistical regions of England used in subsequent elections.
East Midlands Party Seats Aggregate Votes Total Gains Losses Net Of all (%) Total Of all (%) Difference Labour 28 0 2 63.6 879,886 45.1 Conservative 15 1 0 34.1 727,386 37.3 Liberal Democrats 1 1 0 2.3 300,831 15.4 UKIP 0 0 0 0.0 21,764 1.1 Green 0 0 0 0.0 4,865 0.2 Others 0 0 0 0.0 17,173 0.9 Total 44 1,951,905 60.9
East Anglia Party Seats Aggregate Votes Total Gains Losses Net Of all (%) Total Of all (%) Difference Conservative 14 1 1 63.6 434,774 41.7 Labour 7 0 1 31.8 373,397 35.8 Liberal Democrats 1 1 0 4.5 198,244 19.0 UKIP 0 0 0 0.0 22,493 2.2 Green 0 0 0 0.0 8,645 0.8 Others 0 0 0 0.0 5,385 0.5 Total 22 1,042,938 63.7
London Party Seats Aggregate Votes Total Gains Losses Net Of all (%) Total Of all (%) Difference Labour 55 0 2 74.3 1,306,869 47.3 Conservative 13 2 0 17.6 841,751 30.5 Liberal Democrats 6 0 0 8.1 482,888 17.5 Green 0 0 0 0.0 45,933 1.7 UKIP 0 0 0 0.0 26,433 1.0 Others 0 0 0 0.0 56,490 2.0 Total 74 2,760,364 55.2
North East England Party Seats Aggregate Votes Total Gains Losses Net Of all (%) Total Of all (%) Difference Labour 32 0 0 88.9 746,012 55.7 Conservative 3 0 0 8.3 329,965 24.6 Liberal Democrats 1 0 0 2.8 229,560 17.1 UKIP 0 0 0 0.0 10,799 0.8 Green 0 0 0 0.0 3,583 0.3 Others 0 0 0 0.0 19,635 1.5 Total 36 1,339,554 57.6
North West England Party Seats Aggregate Votes Total Gains Losses Net Of all (%) Total Of all (%) Difference Labour 60 0 0 85.7 1,375,509 51.8 Conservative 7 1 1 10.0 752,483 28.3 Liberal Democrats 3 1 0 4.3 438,526 16.5 UKIP 0 0 0 0.0 23,013 0.9 Green 0 0 0 0.0 11,410 0.4 Others 0 0 1 0.0 56,001 2.1 Total 70 2,656,942 55.3
South East England Party Seats Aggregate Votes Total Gains Losses Net Of all (%) Total Of all (%) Difference Conservative 73 2 2 62.4 2,209,050 42.6 Labour 35 0 1 29.9 1,643,314 31.7 Liberal Democrats 9 2 1 7.7 1,121,385 21.6 UKIP 0 0 0 0.0 126,431 2.4 Green 0 0 0 0.0 35,629 0.7 Others 0 0 0 0.0 51,902 1.0 Total 117 5,187,711 61.3
South West England Party Seats Aggregate Votes Total Gains Losses Net Of all (%) Total Of all (%) Difference Conservative 20 1 3 39.2 946,629 38.5 Liberal Democrats 15 2 1 29.4 765,824 31.2 Labour 16 1 0 31.4 645,121 26.3 UKIP 0 0 0 0.0 60,590 2.5 Green 0 0 0 0.0 19,770 0.8 Others 0 0 0 0.0 18,415 0.7 Total 51 2,456,349 64.9
West Midlands Party Seats Aggregate Votes Total Gains Losses Net Of all (%) Total Of all (%) Difference Labour 43 0 1 72.9 1,049,244 44.8 Conservative 13 0 1 22.0 818,749 35.0 Liberal Democrats 2 1 0 3.4 343,929 14.7 UKIP 0 0 0 0.0 43,203 1.8 Health Concern 1 1 0 1.7 28,487 1.2 New Green 0 0 0 0.0 9,732 0.4 Others 0 0 0 0.0 47,037 2.0 Total 59 2,340,381 58.5
Yorkshire and the Humber Party Seats Aggregate Votes Total Gains Losses Net Of all (%) Total Of all (%) Difference Labour 47 0 0 83.9 1,037,114 48.6 Conservative 7 0 0 12.5 644,802 30.2 Liberal Democrats 2 0 0 3.6 365,662 17.1 UKIP 0 0 0 0.0 40,061 1.9 Green 0 0 0 0.0 18,616 0.9 Others 0 0 0 0.0 27,730 1.2 Total 56 2,133,985 56.7
Results by county The below tables summarise the results by county as used by the Boundary Commission for England after the fourth periodic boundary review for Westminster constituencies in England.
Party Seats Aggregate votes Total Gains Losses Net Of all (%) Total Of all (%) Difference Labour 6 0 0 60.0 177,782 36.8 Liberal Democrats 3 0 0 30.0 134,170 27.8 Conservative 1 0 0 10.0 152,030 31.5 Others 0 0 0 0.0 19,185 4.0 Total 10 483,167 64.2
Party Seats Aggregate votes Total Gains Losses Net Of all (%) Total Of all (%) Difference Labour 3 0 0 50.0 109,113 42.8 Conservative 3 0 0 50.0 100,265 39.4 Liberal Democrats 0 0 0 0.0 37,599 14.8 Others 0 0 0 0.0 7,817 3.1 Total 6 254,794 60.9
Party Seats Aggregate votes Total Gains Losses Net Of all (%) Total Of all (%) Difference Conservative 4 0 0 50.0 142,280 40.2 Labour 3 0 0 37.5 108,675 30.7 Liberal Democrats 1 0 0 12.5 91,964 26.0 Others 0 0 0 0.0 11,002 3.1 Total 8 353,921 60.2
Party Seats Aggregate votes Total Gains Losses Net Of all (%) Total Of all (%) Difference Conservative 5 0 0 71.4 145,128 45.5 Labour 2 0 0 28.6 98,165 30.7 Liberal Democrats 0 0 0 0.0 63,221 19.8 Others 0 0 0 0.0 12,724 4.0 Total 7 319,238 63.3
Party Seats Aggregate votes Total Gains Losses Net Of all (%) Total Of all (%) Difference Conservative 5 0 0 71.4 138,798 42.8 Labour 2 0 0 28.6 104,506 32.3 Liberal Democrats 0 0 0 0.0 68,824 21.2 Others 0 0 0 0.0 11,843 3.7 Total 7 323,971 62.2
Party Seats Aggregate votes Total Gains Losses Net Of all (%) Total Of all (%) Difference Labour 7 0 0 63.6 214,236 46.3 Conservative 4 0 0 36.4 164,470 35.6 Liberal Democrats 0 0 0 0.0 72,118 15.6 Others 0 0 0 0.0 11,609 2.5 Total 11 462,433 60.4
Party Seats Aggregate votes Total Gains Losses Net Of all (%) Total Of all (%) Difference Labour 6 0 0 100.0 138,520 46.3 Conservative 0 0 0 0.0 61,092 26.2 Liberal Democrats 0 0 0 0.0 28,966 12.4 Others 0 0 0 0.0 5,015 2.1 Total 6 233,593 56.9
Party Seats Aggregate votes Total Gains Losses Net Of all (%) Total Of all (%) Difference Liberal Democrats 4 0 0 80.0 113,000 44.8 Labour 1 0 0 20.0 43,674 17.3 Conservative 0 0 0 0.0 82,227 32.6 Others 0 0 0 0.0 13,216 5.2 Total 5 252,117 64.6
Party Seats Aggregate votes Total Gains Losses Net Of all (%) Total Of all (%) Difference Labour 7 0 0 100.0 170,329 62.9 Conservative 0 0 0 0.0 55,254 20.4 Liberal Democrats 0 0 0 0.0 38,533 14.2 Others 0 0 0 0.0 6,890 2.5 Total 7 271,006 58.6
Party Seats Aggregate votes Total Gains Losses Net Of all (%) Total Of all (%) Difference Labour 4 0 0 66.7 94,191 38.8 Conservative 2 0 0 33.3 96,163 39.6 Liberal Democrats 0 0 0 0.0 46,736 19.3 Others 0 0 0 0.0 5,563 2.3 Total 6 242,653 63.5
Party Seats Aggregate votes Total Gains Losses Net Of all (%) Total Of all (%) Difference Labour 8 0 0 80.0 227,768 50.0 Conservative 1 0 0 10.0 141,717 31.1 Liberal Democrats 1 0 0 10.0 79,845 17.5 Others 0 0 0 0.0 6,392 1.4 Total 10 455,722 60.9
Party Seats Aggregate votes Total Gains Losses Net Of all (%) Total Of all (%) Difference Conservative 4 0 0 36.4 212,576 39.0 Liberal Democrats 4 0 0 36.4 173,639 31.9 Labour 3 0 0 27.3 128,599 23.6 Others 0 0 0 0.0 30,182 5.5 Total 11 544,996 65.6
Party Seats Aggregate votes Total Gains Losses Net Of all (%) Total Of all (%) Difference Conservative 6 0 0 75.0 156,222 45.3 Liberal Democrats 1 0 0 12.5 108,426 31.5 Labour 1 0 0 12.5 72,715 21.1 Others 0 0 0 0.0 7,339 2.1 Total 8 344,702 63.6
Party Seats Aggregate votes Total Gains Losses Net Of all (%) Total Of all (%) Difference Labour 4 0 0 50.0 105,937 30.2 Conservative 3 0 0 37.5 138,652 39.5 Liberal Democrats 1 0 0 12.5 84,232 24.0 Others 0 0 0 0.0 22,053 6.3 Total 8 350,874 61.2
Party Seats Aggregate votes Total Gains Losses Net Of all (%) Total Of all (%) Difference Conservative 11 0 0 64.7 315,589 42.8 Labour 5 0 0 29.4 255,526 34.7 Liberal Democrats 1 0 0 5.9 122,663 16.7 Others 0 0 0 0.0 42,887 5.8 Total 17 736,665 59.5
Party Seats Aggregate votes Total Gains Losses Net Of all (%) Total Of all (%) Difference Labour 3 0 0 50.0 94,693 33.7 Conservative 2 0 0 33.3 114,812 40.9 Liberal Democrats 1 0 0 16.7 61,656 21.9 Others 0 0 0 0.0 9,855 3.5 Total 6 281,016 64.9
Party Seats Aggregate votes Total Gains Losses Net Of all (%) Total Of all (%) Difference Labour 55 0 0 74.3 1,307,229 47.4 Conservative 13 0 0 17.6 841,751 30.5 Liberal Democrats 6 0 0 8.1 482,888 17.5 Others 0 0 0 0.0 128,855 4.7 Total 74 2,760,723 55.3
Party Seats Aggregate votes Total Gains Losses Net Of all (%) Total Of all (%) Difference Labour 25 0 0 89.3 540,982 53.7 Liberal Democrats 2 0 0 7.1 184,334 18.3 Conservative 1 0 0 3.6 245,361 24.3 Others 0 0 0 0.0 37,573 3.7 Total 28 1,008,250 52.9
Party Seats Aggregate votes Total Gains Losses Net Of all (%) Total Of all (%) Difference Conservative 10 0 0 58.8 316,520 41.5 Liberal Democrats 4 0 0 23.5 211,595 27.8 Labour 3 0 0 17.6 210,610 27.6 Others 0 0 0 0.0 23,583 3.1 Total 17 762,308 60.9
Party Seats Aggregate votes Total Gains Losses Net Of all (%) Total Of all (%) Difference Conservative 4 0 0 50.0 146,806 41.1 Labour 2 0 0 25.0 97,932 27.4 Liberal Democrats 1 0 0 12.5 69,215 19.4 Others 1 0 0 12.5 43,092 12.1 Total 8 357,045 65.1
Party Seats Aggregate votes Total Gains Losses Net Of all (%) Total Of all (%) Difference Conservative 6 0 0 54.5 202,569 41.8 Labour 5 0 0 45.5 188,308 38.9 Liberal Democrats 0 0 0 0.0 81,899 16.9 Others 0 0 0 0.0 11,878 2.5 Total 11 484,654 62.6
Party Seats Aggregate votes Total Gains Losses Net Of all (%) Total Of all (%) Difference Labour 7 0 0 70.0 173,958 46.7 Conservative 3 0 0 30.0 122,005 32.8 Liberal Democrats 0 0 0 0.0 63,664 17.1 Others 0 0 0 0.0 12,528 3.4 Total 10 372,155 56.3
Party Seats Aggregate votes Total Gains Losses Net Of all (%) Total Of all (%) Difference Conservative 1 0 0 100.0 25,223 39.7 Liberal Democrats 0 0 0 0.0 22,397 35.3 Labour 0 0 0 0.0 9,676 15.2 Others 0 0 0 0.0 6,186 9.7 Total 1 63,482 60.8
Party Seats Aggregate votes Total Gains Losses Net Of all (%) Total Of all (%) Difference Conservative 9 0 0 52.9 314,496 43.4 Labour 8 0 0 47.1 272,877 37.7 Liberal Democrats 0 0 0 0.0 112,024 15.5 Others 0 0 0 0.0 24,460 3.4 Total 17 723,857 61.5
Party Seats Aggregate votes Total Gains Losses Net Of all (%) Total Of all (%) Difference Labour 13 0 0 86.7 298,739 46.7 Conservative 2 0 0 13.3 232,940 36.4 Liberal Democrats 0 0 0 0.0 84,827 13.3 Others 0 0 0 0.0 22,618 3.5 Total 15 639,124 59.1
Party Seats Aggregate votes Total Gains Losses Net Of all (%) Total Of all (%) Difference Labour 5 0 0 50.0 182,290 41.5 Conservative 5 0 0 50.0 167,748 38.1 Liberal Democrats 0 0 0 0.0 74,964 17.0 Others 0 0 0 0.0 14,776 3.4 Total 10 439,778 62.2
Party Seats Aggregate votes Total Gains Losses Net Of all (%) Total Of all (%) Difference Conservative 6 0 0 85.7 141,109 46.2 Labour 1 0 0 14.3 109,150 35.7 Liberal Democrats 0 0 0 0.0 49,225 16.1 Others 0 0 0 0.0 5,943 1.9 Total 7 305,427 61.4
Party Seats Aggregate votes Total Gains Losses Net Of all (%) Total Of all (%) Difference Labour 15 0 0 93.8 321,552 53.7 Liberal Democrats 1 0 0 6.2 97,247 17.8 Conservative 0 0 0 0.0 109,965 20.1 Others 0 0 0 0.0 18,624 3.4 Total 16 547,388 51.9
Party Seats Aggregate votes Total Gains Losses Net Of all (%) Total Of all (%) Difference Conservative 4 0 0 50.0 165,174 41.6 Labour 3 0 0 37.5 141,129 35.5 Liberal Democrats 1 0 0 12.5 78,050 19.6 Others 0 0 0 0.0 13,068 3.3 Total 8 397,421 64.1
Party Seats Aggregate votes Total Gains Losses Net Of all (%) Total Of all (%) Difference Labour 5 0 0 83.3 131,835 43.8 Conservative 1 0 0 16.7 123,986 41.2 Liberal Democrats 0 0 0 0.0 37,831 12.6 Others 0 0 0 0.0 7,535 2.5 Total 6 301,187 63.1
Party Seats Aggregate votes Total Gains Losses Net Of all (%) Total Of all (%) Difference Labour 2 0 0 50.0 65,067 43.2 Liberal Democrats 1 0 0 25.0 41,986 27.9 Conservative 1 0 0 25.0 39,368 26.1 Others 0 0 0 0.0 4,269 3.4 Total 4 150,690 62.0
Party Seats Aggregate votes Total Gains Losses Net Of all (%) Total Of all (%) Difference Conservative 4 0 0 50.0 162,679 43.6 Labour 3 0 0 37.5 110,412 29.6 Liberal Democrats 1 0 0 12.5 87,841 23.5 Others 0 0 0 0.0 12,571 3.4 Total 8 373,503 64.5
Party Seats Aggregate votes Total Gains Losses Net Of all (%) Total Of all (%) Difference Labour 9 0 0 81.8 228,843 50.9 Conservative 2 0 0 18.2 152,826 34.0 Liberal Democrats 0 0 0 0.0 58,966 13.1 Others 0 0 0 0.0 9,153 2.0 Total 11 449,788 57.5
Party Seats Aggregate votes Total Gains Losses Net Of all (%) Total Of all (%) Difference Conservative 4 0 0 66.7 108,296 37.9 Labour 1 0 0 16.7 84,269 29.5 Liberal Democrats 1 0 0 16.7 78,007 27.3 Others 0 0 0 0.0 15,092 5.3 Total 6 285,664 62.7
Party Seats Aggregate votes Total Gains Losses Net Of all (%) Total Of all (%) Difference Labour 3 0 0 60.0 80,814 38.1 Conservative 1 0 0 20.0 82,711 39.0 Liberal Democrats 1 0 0 20.6 39,459 18.6 Others 0 0 0 0.0 8,934 4.2 Total 5 211,918 62.8
Party Seats Aggregate votes Total Gains Losses Net Of all (%) Total Of all (%) Difference Conservative 3 0 0 60.0 104,502 40.9 Liberal Democrats 2 0 0 40.0 101,080 39.6 Labour 0 0 0 0.0 42,162 16.5 Others 0 0 0 0.0 7,458 2.9 Total 5 255,202 67.0
Party Seats Aggregate votes Total Gains Losses Net Of all (%) Total Of all (%) Difference Labour 14 0 0 93.3 296,403 58.9 Liberal Democrats 1 0 0 6.7 90,624 18.0 Conservative 0 0 0 0.0 94,503 18.8 Others 0 0 0 0.0 21,282 4.2 Total 15 502,812 52.7
Party Seats Aggregate votes Total Gains Losses Net Of all (%) Total Of all (%) Difference Labour 9 0 0 75.0 229,216 48.0 Conservative 3 0 0 25.0 171,461 35.9 Liberal Democrats 0 0 0 0.0 59,678 12.5 Others 0 0 0 0.0 17,086 3.6 Total 12 477,441 59.0
Party Seats Aggregate votes Total Gains Losses Net Of all (%) Total Of all (%) Difference Conservative 5 0 0 71.4 130,802 40.7 Labour 2 0 0 28.6 127,762 39.7 Liberal Democrats 0 0 0 0.0 51,370 16.0 Others 0 0 0 0.0 11,612 3.6 Total 7 321,546 62.9
Party Seats Aggregate votes Total Gains Losses Net Of all (%) Total Of all (%) Difference Conservative 10 0 0 90.9 236,024 47.6 Liberal Democrats 1 0 0 9.1 133,636 27.0 Labour 0 0 0 0.0 107,897 21.8 Others 0 0 0 0.0 17,878 3.6 Total 11 495,435 62.4
Party Seats Aggregate votes Total Gains Losses Net Of all (%) Total Of all (%) Difference Labour 13 0 0 100.0 277,905 62.9 Conservative 0 0 0 0.0 78,088 17.7 Liberal Democrats 0 0 0 0.0 73,339 16.6 Others 0 0 0 0.0 12,280 2.8 Total 13 441,612 53.4
Party Seats Aggregate votes Total Gains Losses Net Of all (%) Total Of all (%) Difference Labour 4 0 0 80.0 106,093 42.4 Conservative 1 0 0 20.0 98,531 39.4 Liberal Democrats 0 0 0 0.0 39,084 15.6 Others 0 0 0 0.0 6,262 2.5 Total 5 249,970 63.9
Party Seats Aggregate votes Total Gains Losses Net Of all (%) Total Of all (%) Difference Labour 25 0 0 86.2 535,187 51.3 Conservative 4 0 0 13.8 319,267 30.6 Liberal Democrats 0 0 0 0.0 136,493 13.1 Others 0 0 0 0.0 53,085 5.1 Total 29 1,044,032 54.7
Party Seats Aggregate votes Total Gains Losses Net Of all (%) Total Of all (%) Difference Conservative 7 0 0 87.5 164,009 46.0 Labour 1 0 0 12.5 92,261 25.9 Liberal Democrats 0 0 0 0.0 82,152 23.0 Others 0 0 0 0.0 18,405 5.2 Total 8 356,827 61.3
Party Seats Aggregate votes Total Gains Losses Net Of all (%) Total Of all (%) Difference Labour 23 0 0 100.0 456,341 51.5 Conservative 0 0 0 0.0 265,615 30.0 Liberal Democrats 0 0 0 0.0 123,533 14.0 Others 0 0 0 0.0 40,026 4.5 Total 23 885,515 56.7
Party Seats Aggregate votes Total Gains Losses Net Of all (%) Total Of all (%) Difference Conservative 4 0 0 66.7 124,260 42.1 Labour 2 0 0 33.3 85,496 29.0 Liberal Democrats 0 0 0 0.0 73,853 25.0 Others 0 0 0 0.0 11,531 3.9 Total 6 295,140 64.4
This page is based on this
Wikipedia article Text is available under the
CC BY-SA 4.0 license; additional terms may apply.
Images, videos and audio are available under their respective licenses.