Demographics of Macau

Last updated

Demographics of Macau
Macau single age population pyramid 2020.png
Population pyramid of Macau in 2020
Population635,293 (2022 est.)
Growth rate0.75% (2022 est.)
Birth rate5.5 births/1,000 population (2023 est.)
Death rate4.4 deaths/1,000 population (2023 est.)
Life expectancy84.98 years
  male82.09 years
  female88.02 years
Fertility rate0.58 children born/woman (2023 est.)
Infant mortality rate4.59 deaths/1,000 live births
Net migration rate3.15 migrant(s)/1,000 population (2022 est.)
Age structure
0–14 years14.41%
15–64 years70.73%
65 and over14.86%
Sex ratio
Total0.9 male(s)/female (2022 est.)
At birth1.05 male(s)/female
Under 151.05 male(s)/female
65 and over0.74 male(s)/female
Nationality
NationalityChinese
Major ethnicHan Chinese (88.7%)
Language
SpokenCantonese (80.1%)
Street scene in Macau Streetscene Macau.jpg
Street scene in Macau

Demographic features of the population of Macau include population density, ethnicity, education level, health of the populace, economic status, religious affiliations and other aspects of the population.

Contents

Macau's population is 95% Chinese, primarily Cantonese and some Hakka, both from the nearby Guangdong Province. The majority of the remainder are of Portuguese or mixed Chinese-Portuguese ancestry. Some Japanese, including descendants of Japanese Catholics who were expelled by shōguns, also live in Macau.

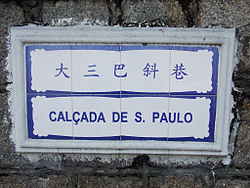
The official languages are Portuguese and Cantonese Chinese. The residents commonly (85.7%) speak Cantonese, Mandarin is spoken by 3.2% at home, about 40% are able to communicate in standard Mandarin. English and Portuguese are spoken as a first language by 1.5% and 0.6% respectively, while English is widely taught as a second language. The other popular topolect is Hokkien (Min Nan), spoken by a small percentage of the population. The creole Macanese language (Patuá or Macaista Chapado) is almost extinct.

Population size and structure

624,000 [1] (2014 Qtr2 est.)

Structure of the population

Population Estimates by Sex and Age Group (01.VII.2020): [2]

Age GroupMaleFemaleTotal%
Total326 700358 700685 400100
0–416 70015 30032 0004.67
5–918 00016 20034 2004.99
10–1412 90011 50024 4003.56
15–1912 70012 30025 0003.65
20–2422 10022 10044 2006.45
25–2925 80024 80050 6007.38
30–3435 90039 00074 90010.93
35–3930 90035 10066 0009.63
40–4423 50027 30050 8007.41
45–4922 30028 80051 1007.46
50–5419 60028 20047 8006.97
55–5923 80030 30054 1007.89
60–6422 80023 90046 7006.81
65–6916 50017 20033 7004.92
70–7411 50011 10022 6003.30
75–795 5005 30010 8001.58
80–843 3004 3007 6001.11
85+2 9006 0008 9001.30
Age groupMaleFemaleTotalPercent
0–1447 60043 00090 60013.22
15–64239 400271 800511 20074.58
65+39 70043 90083 60012.20

Vital statistics

The following are data on vital statistics. [3] [4]

Average populationLive birthsDeathsNatural changeCrude birth rate (per 1000)Crude death rate (per 1000)Natural change (per 1000)TFR
1970248,6002,6761,5161,16011.65.56.02.167
1971246,2002,6371,5431,09410.95.55.41.979
1972243,9002,7501,5391,21110.35.44.91.818
1973241,7002,6861,4101,27610.05.44.61.679
1974239,4002,7811,5791,2029.75.44.31.562
1975237,0002,5831,3981,1859.75.44.31.478
1976234,2002,3691,51785210.25.44.71.437
1977231,7002,5321,4241,10811.05.55.61.445
1978233,1002,4071,3601,04712.45.56.91.499
1979237,3003,0191,5041,51514.15.68.51.591
1980242,0003,7841,5552,22916.05.610.41.709
1981247,6004,2071,4652,74218.05.612.41.835
1982261,7005,2621,4886,75019.85.614.21.953
1983276,9006,1681,5144,65421.35.615.82.046
1984288,8006,6661,4885,17822.45.516.92.104
1985290,6007,5601,4666,09422.95.317.62.121
1986301,5007,4771,3246,15322.95.217.72.094
1987312,2007,5651,3216,24422.45.017.32.031
1988319,8007,9131,4376,47621.54.916.61.944
1989330,4007,5681,5166,05220.34.715.61.838
1990339,5006,8721,4825,39019.04.514.51.722
1991363,8006,8321,3355,49717.64.413.21.605
1992378,0006,6761,4325,24416.24.312.01.494
1993390,0006,2671,5314,73614.94.210.81.394
1994403,6006,1151,3304,78513.84.19.71.308
1995415,0005,8761,3514,52512.84.08.81.236
1996415,2005,4681,4134,05512.04.08.01.174
1997419,4005,0311,2933,73811.13.97.21.116
1998425,2004,4341,3563,07810.33.96.41.059
1999429,6004,1481,3742,7749.63.95.71.002
2000431,5003,8491,3382,5118.83.95.00.95
2001436,3003,2411,3271,9148.23.84.40.818
2002440,5003,1621,4151,7477.73.83.90.813
2003446,7003,2121,4741,7387.53.83.70.837
2004462,6003,3081,5331,7757.43.83.60.855
2005484,3003,6711,6152,0567.53.83.70.912
2006509,9004,0581,5662,4927.83.84.00.954
2007531,8004,5371,5452,9928.23.74.51.008
2008543,1004,7171,7562,9618.73.75.00.979
2009533,3004,7641,6443,1209.33.75.61.004
2010540,6005,1141,7743,3409.93.76.21.070
2011557,4005,8521,8454,00710.43.76.81.150
2012582,0007,3151,8415,47410.93.77.31.357
2013607,5006,5711,9204,65111.43.77.71.150
2014636,2007,3601,9395,42111.73.78.01.224
2015646,8007,0552,0025,05312.03.88.21.142
2016644,9007,1462,2384,90812.13.88.31.138
2017653,1006,5292,1204,40910.03.26.81.021
2018667,4005,9252,0693,8569.03.15.90.915
2019679,6005,9792,2823,6978.93.45.50.899
2020683,1005,5452,2303,3158.13.34.80.841
2021683,2005,0262,3202,7067.43.44.00.756
2022672,8004,3443,0041,3406.54.52.00.680
2023683,7003,7122,9817315.54.41.10.586
20243,6072,4771,130

Current vital statistics

[5]

PeriodLive birthsDeathsNatural increase
January – September 20232,7512,347+404
January – September 20242,8191,847+972
DifferenceIncrease2.svg +68 (+2.47%)Decrease Positive.svg -500 (−21.3%)Increase2.svg +568

Life expectancy at birth

Macao is the territory with the world's second highest life expectancy behind Hong Kong.

PeriodLife expectancy in

Years

PeriodLife expectancy in

Years

1950–195561.01985–199076.6
1955–196063.61990–199578.1
1960–196566.01995–200079.8
1965–197068.12000–200581.0
1970–197570.72005–201082.1
1975–198073.12010–201583.3
1980–198574.8

Source: UN World Population Prospects [6]

Ethnic groups

The following are information on ethnicity and nationalities based on data from the Statistics and Census Service. [7]

Population of Macau according to ethnic group 1991–2011
Ethnic
group
1991 census2001 census2011 census
Number %Number %Number %
Chinese338,19195.1416,35395.7510,38392.4
Chinese & Portuguese4,4771.34,2541.04,0190.7
Portuguese4,2211.22,8100.63,4850.6
Chinese & non-Portuguese1,7710.41,6010.3
Others7,8042.210,0472.333,0156.0
Portuguese & others7090.26020.1
Total355,693435,235552,503

Place of birth

Immigration is an essential component of the population. Results of the 2011 Population Census indicated that 326,376 (59.1% of the total population) were born outside Macau, an increase of 3.0 percentage points over the last ten years. Analysed by place of birth, 255,186 (46.2%) were born in Mainland China, down by 1.2 percentage points from 2001. 226,127 (40.9%) were born in Macau, 19,355 (3.5%) in Hong Kong and 1,835 (0.3%) in Portugal. There were more persons born in other countries or territories as the number of non-resident workers increased. Among them, 14,544 were born in the Philippines, 7,199 in Vietnam and 6,269 in Indonesia, altogether taking up 5.1% of the total population. 1,942 were born in Europe other than Portugal, 2,252 in Americas, 959 in Africa and 672 in Oceania. Analysed by age group, 85.2% of the youth population (aged 0–14) were born in Macau, and 62.9% of those aged 35 and above were born in Mainland China.

As of 2011 35,578 people in Macau were originally from Fujian province in Mainland China, making up about 25% of the Mainland China-born people. The number of Fujianese in Macau increased after the 1999 handover. [8]

Nationality

Analysed by nationality, 509,788 (92.3% of the total population) were of Chinese nationality, down by 2.9 percentage points from the 2001 Census; meanwhile, only 0.9% was of Portuguese nationality, a decrease of 1.1 percentage points. These figures can be misleading, because more than a 100,000 people in Macau are holders of a Portuguese passport, making them in effect Portuguese citizens. Over the last ten years, diversity of the various components of the population is enhanced as economic development has drawn people to invest, work or study in Macau; consequently, 37,695 (6.8%) were of other nationalities, up by 4.0 percentage points, with 2.7% being Filipinos. Macau is a Chinese community and those of Chinese ethnicity totaled 510,383, an increase of 94,030 over the past ten years; however, its proportion to the total population decreased by 3.3 percentage points to 92.4%. Those of wholly or partly Portuguese ethnicity totaled 8,106, up slightly by 333 compared with 2001; its proportion to the total decreased by 0.3 percentage point to 1.5%.

Religion

Religion in Macau [9]
Religion %
Shenism
30%
Buddhism, Taoism
10%
Christianity
5%
No affiliation
50%
Others
10%
30% Shenism, 10% Buddhism or Taoism, 5% Christianity, 50% not declaring religious affiliation, 10% others (2009). [9] Another survey conducted between 2005, 2007 and 2009 has found that 30% of the population follows folk faiths, 10% are adherents of Buddhism or Taoism, 5% are Christians, and the remaining part do not declare religious adherence. [10]

Languages

Portuguese and Chinese, seen on this street sign, are official languages in Macau CalcadaSaoPaulomacau.jpg
Portuguese and Chinese, seen on this street sign, are official languages in Macau
Portuguese and Chinese are official languages. The Chinese standard (Cantonese or Mandarin) is not specified in the law.

See also

References

  1. "Demographic Statistics for the 2nd Quarter 2014". Statistics and Census Service. 11 August 2014.
  2. "Demographic Yearbook 2021 – Table 7". United Nations Statistics Division. Retrieved 2022-12-11.
  3. "Demographic Yearbooks". United Nations.
  4. "Dsec – 人口". Statistics and Census Service.
  5. "Demographic Statistics".
  6. "World Population Prospects – Population Division". United Nations. Retrieved 2017-07-15.
  7. Statistics and Census Service (2012). Results of 2011 Population Census (Report). Macau: Statistics and Census Service (DSEC).
  8. "Macau: The rise and fall of an empire?". South China Morning Post . November 12, 2015. Archived from the original on July 7, 2016. Retrieved August 15, 2016.{{cite web}}: CS1 maint: bot: original URL status unknown (link) ()
  9. 1 2 Zhidong Hao, 2011. pp. 121–122.
  10. Zheng, VWT; Wan, PS. Religious beliefs and life experiences of Macao's residents 澳門居民的宗教信仰與生活經驗. On: Modern China Studies by Center for Modern China, 2010, v. 17 n. 4, p. 91-126. ISSN   2160-0295. «Drawing on empirical data obtained from three consecutive territory-wide household surveys conducted in 2005, 2007, and 2009 respectively, this paper attempts to shed light on the current religious profile of Macao residents.»