Demographic features of South Korea's population include population density, ethnicity, education level, health, economic status, religious affiliations, and other aspects of the population. The common language and especially culture are widely considered more important elements by South Koreans in terms of identity than citizenship.
In 2012, South Korea's population surpassed 50 million citizens for the first time in history,[3] and by the end of 2021, the country's population had peaked at approximately 51.77 million people.[4] However, in recent years the total fertility rate (TFR) of South Korea has plummeted, leading some researchers to suggest that if current trends continue, the country's population will shrink to approximately 28 million people by the end of the 21st century.[5] In 2018, fertility in South Korea became a topic of international debate after only 26,500 babies were born in October and an estimated 325,000 babies for the year, causing the country to achieve the lowest birth rate in the world.[6][7][8] In a further indication of South Korea's dramatic decline in fertility, in 2020 the country recorded more deaths than births, resulting in a population decline for the first time since modern records began.[9][10] In 2024, South Korea had a total fertility rate of 0.75, the lowest in the world.
South Korea's population decline has been a direct result of record-low birth rates, which have been, according to many experts and researchers, a consequence of the country's high economic inequality, relatively high costs of living, low wages for an OECD member country, lack of job opportunities for young adults, and rising housing costs.[11] Additionally, South Korea is also the country with the highest suicide rate among OECD member states and the wider developed world.[12]
In South Korea, a variety of different Asian people had migrated to the Korean Peninsula in past centuries; however, few have remained permanently. South Korea is a highly homogenous nation, but has in recent decades become home to a number of foreign residents (4.37%), whereas North Korea has not experienced this trend. However, many of them are ethnic Koreans with foreign citizenship. Many residents from China, post-Soviet states, the United States, and Japan are, in fact, repatriated ethnic Koreans (labeled "Overseas Koreans") who may meet criteria for expedited acquisition of South Korean citizenship.[13] For example, migrants from the People's Republic of China (PRC) make up 56.5% of foreign nationals; however, approximately 70% of the Chinese citizens in Korea are Joseonjok (조선족), PRC citizens of Korean ethnicity.[14]
The population of South Korea showed robust growth since the republic's establishment in 1948, and then dramatically slowed down with the effects of its economic growth. In the first official census, taken in 1949, the total population of South Korea was calculated at 20,188,641 people. The 1985 census total was 40,466,577. Population growth was slow, averaging about 1.1% annually during the period from 1949 to 1955, when the population registered at 21.5 million. Growth accelerated between 1955 and 1966 to 29.2 million or an annual average of 2.8%, but declined significantly during the period 1966 to 1985 to an annual average of 1.7%. Thereafter, the annual average growth rate was estimated to be less than 1%, similar to the low growth rates of most industrialized countries and to the target figure set by the Ministry of Health and Social Affairs for the 1990s. As of January 1, 1989, the population of South Korea was estimated to be approximately 42,200,000.[16]
The proportion of the total population under fifteen years of age has risen and fallen with the growth rate. In 1955, approximately 41.2% of the population was under fifteen years of age, a percentage that rose to 43.5% in 1966 before falling to 38.3% in 1975, 34.2% in 1980, and 29.9% in 1985. In the past, the large proportion of children relative to the total population put great strains on the country's economy, particularly because substantial resources were invested in education facilities. With the slowdown in the population growth rate and a rise in the median age (from 18.7 years to 21.8 years between 1960 and 1980), the age structure of the population has begun to resemble the columnar pattern typical of developed countries, rather than the pyramidal pattern found in most parts of the Third World.[17]
The decline in the population growth rate and in the proportion of people under fifteen years of age after 1966 reflected the success of official and unofficial birth control programs. The government of President Syngman Rhee (1948–60) was conservative in such matters. Although Christian churches initiated a family planning campaign in 1957, it was not until 1962 that the government of Park Chung Hee, alarmed at the way in which the rapidly increasing population was undermining economic growth, began a nationwide family planning program. Other factors that contributed to a slowdown in population growth included urbanization, later marriage ages for both men and women, higher education levels, a greater number of women in the labor force, and better health standards.[17]
Public and private agencies involved in family planning included the Ministry of Health and Social Affairs, the Ministry of Home Affairs, the Planned Parenthood Federation of Korea, and the Korea Institute of Family Planning. In the late 1980s, their activities included the distribution of free birth control devices and information, classes for women on family planning methods, and the granting of special subsidies and privileges (such as low-interest housing loans) to parents who agreed to undergo sterilization. There were 502,000 South Koreans sterilized in 1984, as compared with 426,000 in the previous year.[18]
The 1973 Maternal and Child Health Law legalized abortion. In 1983, the government began suspending medical insurance benefits for maternal care for pregnant women with three or more children. It also denied tax deductions for education expenses to parents with two or more children.[19]
As in China, cultural attitudes posed problems for family planning programs. A strong preference for sons—who in Korea's traditional Confucian value system are expected to care for their parents in old age and carry on the family name—means that parents with only daughters usually continued to have children until a son is born. The government encouraged married couples to have only one child. This has been a prominent theme in public service advertising, which stresses "have a single child and raise it well."[19]
Total fertility rates (the average number of births a woman will have during her lifetime) fell from 6.1 births per female in 1960 to 4.2 in 1970, 2.8 in 1980, and 2.4 in 1984. The number of live births, recorded as 711,810 in 1978, grew to a high of 917,860 in 1982. This development stirred apprehensions among family planning experts of a new "baby boom." By 1986, however, the number of live births had declined to 806,041.[19]
Decline in population growth continued, and between 2005 and 2010 total fertility rate for South Korean women was 1.21, one of the world's lowest according to the United Nations.[20] Fertility rate well below the replacement level of 2.1 births per female has triggered a national alarm, with some predicting an aging society unable to grow or support its elderly. Recent Korean governments have prioritized the issue on their agenda, promising to enact social reforms that will encourage women to have children.[citation needed]
The country's population increased to 46 million by the end of the twentieth century, with growth rates ranging between 0.9% and 1.2%.[citation needed] The population is expected to stabilize (that is, cease to grow) in the year 2023 at around 52.6 million people.[19][needs update] In the words of Asiaweek magazine, the "stabilized tally will approximate the number of Filipinos in 1983, but squeezed into less than a third of their [the Philippines'] space."[19]
As of early 2019, the birth rate of South Korea reached an alarmingly low number. In February 2019, the Korean TFR fell to 0.98, well below the replacement level of 2.1 births. South Korea is now the fastest-aging developed country in the world. The Korean government (and its failing actions against the birth rate issue) and the worsening economic environment for young people are blamed as the main causes.[21]
South Korea is one of the world's most densely populated countries, with an estimated 425 people per square kilometer in 1989—over sixteen times the average population density of the United States in the late 1980s. By comparison, China had an estimated 114 people, the Federal Republic of Germany (West Germany) 246 people, and Japan 323 people per square kilometer in the late 1980s. Because about 70% of South Korea's land area is mountainous and the population is concentrated in the lowland areas, actual population densities were in general greater than the average. As early as 1975, it was estimated that the density of South Korea's thirty-five cities, each of which had a population of 50,000 or more inhabitants, was 3,700 people per square kilometer. Because of continued migration to urban areas, the figure was higher in the late 1980s.[22]
In 1988 Seoul had a population density of 17,030 people per square kilometer as compared with 13,816 people per square kilometer in 1980. The second largest city, Busan, had a density of 8,504 people per square kilometer in 1988 as compared with 7,272 people in 1980. Gyeonggi Province, which surrounds the capital and contains Incheon, the country's fourth largest city, was the most densely populated province; Gangwon Province in the northeast was the least densely populated province.[23]
According to the government's Economic Planning Board, the population density will be 530 people per square kilometer by 2023, the year the population is expected to stabilize.[23]
Rural areas in South Korea consist of agglomerated villages in river valleys and range from a few houses to several hundred.[24] These villages are located in the south that are backed by hills and give strong protection from winter winds.[24]
Since 1960, the pace of urbanization in South Korea has hit a considerable decline in population of rural areas and the traditional rural lifestyle has been slowly fading away.[24]
Over the past 20 years, South Korea has recorded some of the lowest fertility and marriage levels in the world. As of 2024, it is the country with the world's lowest total fertility rate (TFR), standing at 0.75.[25] Additionally, the country's capital, Seoul, registered a TFR of 0.64, which was likely the lowest level anywhere in the world.[26][27]
Low birth rates have discouraged South Korean doctors from entering pediatrics out of the fear that the field has no future. Due to how medical insurance is structured in South Korea, pediatric care relies especially on volume to compensate for its low reimbursement rates. The number of pediatric facilities in Seoul fell by 12.5 percent between 2018 and 2022, compared to an increase of 76.8 percent for psychiatry clinics and a 41.2 percent rise for anesthesiology centers. Conditions such as overcrowded waiting rooms and a shortage of hospital beds have led to the death of at least one child. The difficulty in obtaining pediatric care is causing many South Korean couples to reconsider having babies.[28]
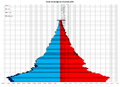
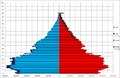
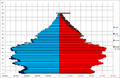
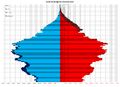
Population of South Korea by age and sex (demographic pyramid)
as on 1955-09-01
as on 1960-11-01
as on 1965-11-01
as on 1970-10-01
as on 1975-11-01
as on 1980-11-01
as on 1985-11-01
as on 1990-11-01
as on 1995-11-01
as on 2000-11-01
as on 2005-11-01
as on 2010-11-01
as on 2015-11-01
Population by Sex and Age Group (Census 01.XI.2015):[29]
Age group
Male
Female
Total
%
Total
25 608 502
25 460 873
51 069 375
100%
0–4
1 159 011
1 099 659
2 258 670
4.42%
5–9
1 169 770
1 098 081
2 267 851
4.44%
10–14
1 262 770
1 165 022
2 427 792
4.75%
15–19
1 668 683
1 525 396
3 194 079
6.25%
20–24
1 887 776
1 643 332
3 531 108
6.91%
25–29
1 728 888
1 536 400
3 265 288
6.39%
30–34
1 986 796
1 824 814
3 811 610
7.46%
35–39
2 022 466
1 904 396
3 926 862
7.69%
40–44
2 218 442
2 120 385
4 338 827
8.50%
45–49
2 217 013
2 171 144
4 388 157
8.59%
50–54
2 153 186
2 110 261
4 263 447
8.35%
55–59
1 969 232
1 987 617
3 956 849
7.75%
60–64
1 379 694
1 441 763
2 821 457
5.52%
65–69
1 028 129
1 115 894
2 144 023
4.20%
70–74
793 855
976 886
1 770 741
3.47%
75–79
553 178
809 491
1 362 669
2.67%
80–84
276 627
537 595
814 222
1.59%
85–89
98 855
274 132
372 987
0.73%
90–94
28 759
95 964
124 723
0.24%
95–99
4 923
19 873
24 796
0.05%
100+
449
2 768
3 217
0.01%
Age group
Male
Female
Total
Percent
0–14
3 591 551
3 362 762
6 954 313
13.62%
15–64
19 232 176
18 265 508
37 497 684
73.42%
65+
2 784 775
3 832 603
6 617 378
12.96%
Population Estimates by Sex and Age Group (01.VII.2018) (Data refer to national projections.):[29]
Age group
Male
Female
Total
%
Total
25 863 502
25 743 131
51 606 633
100%
0–4
1 041 546
990 466
2 032 012
3.94%
5–9
1 177 422
1 112 213
2 289 635
4.44%
10–14
1 172 820
1 094 921
2 267 741
4.39%
15–19
1 469 053
1 348 192
2 817 245
5.46%
20–24
1 856 658
1 639 906
3 496 564
6.78%
25–29
1 868 308
1 629 072
3 497 380
6.78%
30–34
1 766 587
1 599 914
3 366 501
6.52%
35–39
2 116 733
1 983 849
4 100 582
7.95%
40–44
2 023 646
1 932 121
3 955 767
7.67%
45–49
2 311 564
2 245 193
4 556 757
8.83%
50–54
2 076 615
2 046 927
4 123 542
7.99%
55–59
2 163 953
2 175 966
4 339 919
8.41%
60–64
1 669 024
1 721 804
3 390 828
6.57%
65–69
1 133 201
1 225 188
2 358 389
4.57%
70–74
826 425
969 862
1 796 287
3.48%
75–79
664 618
915 752
1 580 370
3.06%
80–84
355 962
632 408
988 370
1.92%
85–89
128 560
330 914
459 474
0.89%
90–94
32 990
115 467
148 457
0.29%
95–99
7 260
29 581
36 841
0.07%
100+
557
3 415
3 972
0.01%
Age group
Male
Female
Total
Percent
0–14
3 391 788
3 197 600
6 589 388
12.77%
15–64
19 322 141
18 322 944
37 645 085
72.95%
65+
3 149 573
4 222 587
7 372 160
14.29%
Population by Sex and Age Group (Census 01.XI.2020) (Data include both Koreans and foreigners. De jure residence refers to expected length of stay of more than three months.):[30]
South Korea faces the issue of a rapidly aging population. In fact, the speed of aging in Korea is unprecedented in human history,[31] 18 years to double aging population from 7–14% (fewest years),[32] overtaking even Japan. Statistics support this observation; the percentage of elderly aged 65 and above, has sharply risen from 3.3% in 1955 to 10.7% in 2009.[33] The shape of its population has changed from a pyramid in the 1990s, with more young people and fewer old people, to a diamond shape in 2010, with fewer young people and a large proportion of middle-aged individuals.[31]
South Korea population pyramid 1960–2020
There are several implications and issues associated with an aging population. A rapidly aging population is likely to have several negative implications on the labour force. In particular, experts predict that this might lead to a shrinking of the labour force. As an increasing proportion of people enter their 50s and 60s, they either choose to retire or are forced to retire by their companies. As such, there would be a decrease in the percentage of economically active people in the population. Also, with rapid aging, it is highly likely that there would be an imbalance in the young-old percentage of the workforce. This might lead to a lack of vibrancy and innovation in the labour force, since it is helmed mainly by the middle-aged workers. Data shows that while there are fewer young people in society, the percentage of the economically active population, made up of people ages 15–64, has increased by 20% from 55.5% to 72.5%.[33] This shows that the labour force is indeed largely made up of middle-aged workers.
A possible consequence might be that South Korea would be a less attractive candidate for investment. Investors might decide to relocate to countries like Vietnam, where there is an abundance of cheaper, younger labour. If employers were to choose to maintain operations in South Korea, there is a possibility that they might incur higher costs in retraining or upgrading the skills of this group of middle-age workers. On top of that, higher healthcare costs might also be incurred[34] and the government would need to set aside more money to maintain a good healthcare system to cater to the elderly.
Due to the very low birth rate, South Korea is predicted to enter a Russian Cross pattern once the large generation born in the 1960s starts to die off, with potentially decades of population decline.
Since 2016, the number of elderly people (aged 65 and older) has outnumbered children (0–14 years) and the country has become an "aged society." People older than 65 make up more than 14% of the total population.[21]
Like other newly industrializing economies, South Korea experienced rapid growth of urban areas caused by the migration of large numbers of people from the countryside.[35] In the eighteenth and nineteenth centuries, Seoul, by far the largest urban settlement, had a population of about 190,000 people. There was a striking contrast with Japan, where Edo (Tokyo) had as many as 1 million inhabitants and the urban population comprised as much as 10% to 15% of the total during the Tokugawa Period (1600–1868). During the closing years of the Joseon period and the first years of Japanese colonial rule, the urban population of Korea was no more than 3% of the total. After 1930, when the Japanese began industrial development on the Korean Peninsula, particularly in the northern provinces adjacent to Manchuria, the urban portion of the population began to grow, reaching 11.6% for all of Korea in 1940.[35]
Between 1945 and 1985, the urban population of South Korea grew from 14.5% to 65.4% of the total population. In 1988, the Economic Planning Board estimated that the urban portion of the population would reach 78.3% by the end of the twentieth century. Most of this urban increase was attributable to migration rather than to natural growth of the urban population. Urban birth rates have generally been lower than the national average. The extent of urbanization in South Korea, however, is not fully revealed in these statistics. Urban population was defined in the national census as being restricted to those municipalities with 50,000 or more inhabitants. Although many settlements with fewer than 50,000 inhabitants were satellite towns of Seoul or other large cities or mining communities in northeastern Gangwon Province, which would be considered urban in terms of the living conditions and occupations of the inhabitants, they were still officially classified as rural.[35]
The dislocation caused by the Korean War accounted for the rapid increase in urban population during the early 1950s. Hundreds of thousands of refugees, many of them from North Korea, streamed into the cities. During the post-Korean War period, rural people left their ancestral villages in search of greater economic and educational opportunities in the cities. By the late 1960s, migration had become a serious problem, not only because cities were terribly overcrowded, but also because the rural areas were losing the most youthful and productive members of their labor force.[35]
In 1970, the Park Chung Hee government launched the Saemaul Undong (New Community Movement) as a rural reconstruction and self-help movement to improve economic conditions in the villages, close the wide gap in income between rural and urban areas, and stem urban migration—as well as to build a political base. Despite a huge amount of government-sponsored publicity, especially during the Park era, it was not clear by the late 1980s that the Saemaul undong had achieved its objectives. By that time, many, if not most, farming and fishing villages consisted of older persons; relatively few able-bodied men and women remained to work in the fields or to fish. This trend was apparent in government statistics for the 1986–87 period: the proportion of people fifty years old or older living in farming communities grew from 28.7% in 1986 to 30.6% in 1987, while the number of people in their twenties living in farming communities declined from 11.3% to 10.8%. The nationwide percentages for people fifty years old or older and in their twenties were, in 1986, 14.9% and 20.2%, respectively.[35]
In 1985, the largest cities were Seoul (9,645,932 inhabitants), Busan (3,516,807), Daegu (2,030,672), Incheon (1,387,491), Gwangju (906,129), and Daejeon (866,695). According to government statistics, the population of Seoul, one of the world's largest cities, surpassed 10 million people in late 1988. Seoul's average annual population growth rate during the late 1980s was more than 3%. Two-thirds of this growth was attributable to migration rather than to natural increase. Surveys revealed that "new employment or seeking a new job," "job transfer," and "business" were major reasons given by new immigrants for coming to the capital. Other factors cited by immigrants included "education" and "a more convenient area to live."[35]
To alleviate overcrowding in Seoul's downtown area, the city government drew up a master plan in the mid-1980s that envisioned the development of four "core zones" by 2000: the original downtown area, Yongdongpo-Yeouido, Yongdong, and Jamsil. Satellite towns would also be established or expanded. In the late 1980s, statistics revealed that the daytime or commuter population of downtown Seoul was as much as six times the officially registered population. If the master plan is successful, many commuters will travel to work in a core area nearer their homes, and the downtown area's daytime population will decrease. Many government ministries have been moved out of Seoul, and the army, navy, and air force headquarters have been relocated to Daejeon.[35][needs update]
In 1985, the population of Seoul constituted 23.8% of the national total. Provincial cities, however, experienced equal and, in many cases, greater expansion than the capital. Growth was particularly spectacular in the southeastern coastal region, which encompasses the port cities of Busan, Masan, Yosu, Jinhae, Ulsan, and Pohang. Census figures show that Ulsan's population increased eighteenfold, growing from 30,000 to 551,300 inhabitants between 1960 and 1985. With the exception of Yosu, all of these cities are in South Gyeongsang Province, a region that has been an especially favored recipient of government development projects. By comparison, the population of Gwangju, capital of South Jeolla Province, increased less than threefold between 1960 and 1985, growing from 315,000 to 906,129 inhabitants.[35]
Rapid urban growth has brought familiar problems to developed and developing countries alike. The construction of large numbers of high-rise apartment complexes in Seoul and other large cities alleviated housing shortages to some extent. But it also imposed hardship on the tens of thousands of people who were obliged to relocate from their old neighborhoods because they could not afford the rents in the new buildings. In the late 1980s, squatter areas consisting of one-story shacks still existed in some parts of Seoul. Housing for all but the wealthiest was generally cramped. The concentration of factories in urban areas, the rapid growth of motorized traffic, and the widespread use of coal for heating during the severe winter months caused dangerous levels of air and water pollution,[35] issues that still persist today even after years of environmentally friendly policies.
In 2016, 82.59 percent of South Korea's total population lived in urban areas and cities.[36]
Vital statistics
Live births and deaths of South Korea 1925–2019Crude birth and death rate of South Korea 1925–2019
South Korea is a largely ethnically homogeneous country with an absolute majority of the Korean ethnicity from estimates but the country itself doesn't collect ethnic or racial data formally.[49] However, with its emergence as an economic powerhouse, demand for foreign immigrants increased and in 2007 the number of foreign citizen residents in South Korea passed the one million mark for the first time in history,[50] and the number reached 2 million in 2016. Of those, 1,016,000 came from China, with more than half of them being ethnic Koreans of Chinese citizenship. The next largest group was from Vietnam with 149,000 residents. The third largest group was from the United States with 117,000 residents, excluding the American troops stationed in the country. Thailand, Philippines, Kazakhstan and other countries followed.[citation needed] Many of the foreign residents from China and the former Soviet Union, including Russia and Kazakhstan, are ethnic Koreans (see Koreans in China, Koryo-saram). The number of foreign residents in the country last month set a record-high 2.73 million, comprising 5.3% of the national population of 51,164,582.
Chinese in South Korea
Since The People's Republic of China and South Korea established their diplomatic relationship in 1992, the number of Chinese immigrants, majorly Joseonjok, has continued to increase.[51] In the early 1990s, a trade agreement allowed merchants from China to conduct business trades in South Korea.[51] There are also Chaoxianzu in Korea: Chinese nationals of Korean ethnicity living in South Korea.
North Americans in South Korea
South Korea is a country with one of the largest American immigrant populations in the world, numbering over 100,000.[52] Most Americans tend to be Korean Americans who have returned to South Korea. About 43,000 Korean Americans reported living in South Korea in 2020, more than twice the number in 2005.[13] South Korea also has a Canadian population of over 20,000.[51][failed verification]
Vietnamese in South Korea
The relationship between Vietnamese and Koreans date back to when Lý Dương Côn left for Goryeo after succession of power dispute. Likewise in 1226, Lý Long Tường, a prince of the Lý dynasty of Đại Việt (in modern-day Vietnam), later became Yi Yongsang (이용상) of Hwasan, a general of Korea. He is an ancestor of one branch of the Lee (or Rhee) family today in South Korea.[53] Nowadays, most Vietnamese immigrants are either manual labor workers, marriage immigrants, or cooks in Vietnamese cuisines.[51][54]
Filipinos in South Korea
Relationship between Filipinos and South Koreans can be traced back to 1950s during the Korean War.[51] Over 7,500 Filipino soldiers fought on the United Nations' side to help South Korea.[51] As of 2019, there were more than 55,000 Filipino immigrants living in South Korea.[51] Population decline in rural regions led to shortage of young people especially young women in those areas [51] and it led many Koreans to marry Filipino brides.[51]
The Korean language is the native language spoken by the vast majority of the population. English is widely taught in both public and private schools as a foreign language. However, general fluency in English in the country is relatively low compared to other industrialized developed countries. There is a Chinese minority who speak Mandarin and Cantonese. Some elderly people may still be able to speak Japanese, which was de facto (1910–1938) and de jure (1938–1945) official during the Japanese rule in Korea.[55][unreliable source?]
In different areas of South Korea, different dialects are spoken. For example, the Gyeongsang dialect spoken around Busan and Daegu to the south is often perceived to sound quite rough and aggressive compared to standard Korean.[55][fact or opinion?]
Koreans have historically lived under the religious influences of Korean shamanism, Buddhism, Daoism, or Confucianism.[56]
Korea is a country where three of the world's major religions, Christianity, Buddhism, and Confucianism, peacefully coexist.[57] According to 2015 statistics, 43.1% of Korean population has a religion and 2008 statistics show that over 510 religious organizations were in the South Korea population.[57]
Most emigrated for economic reasons; employment opportunities were scarce, and many Korean farmers lost their land after the Japanese introduced a system of land registration and private land tenure, imposed higher land taxes, and promoted the growth of an absentee landlord class charging exorbitant rents. Koreans from the northern provinces of Korea migrated mainly to Manchuria, China, and Siberia. Most people from the southern provinces went to Japan or the United States. Koreans were conscripted into Japanese labor battalions or the Japanese army, especially during World War II. In the 1940–44 period, nearly 2 million Koreans lived in Japan, 1.4 million in Manchuria, 600,000 in Siberia, and 130,000 in China. An estimated 40,000 Koreans were scattered among other countries, mainly the United States. At the end of World War II, approximately 2 million Koreans were repatriated from Japan and Manchuria.[35]
More than 4 million ethnic Koreans lived outside the peninsula during the early 1980s. The largest group, about 1.7 million people, lived in China, the descendants of the Korean farmers who had left the country during the Japanese occupation. Most had assumed Chinese citizenship. The Soviet Union had about 430,000 ethnic Koreans, known as the Koryo-saram, scattered in several Soviet republics.[60]
By contrast, many of Japan's approximately 700,000 Koreans had below-average standards of living. This situation occurred partly because of discrimination by the Japanese majority and partly because a large number of resident Koreans, loyal to the North Korean regime of Kim Il Sung, preferred to remain separate from and hostile to the Japanese mainstream. The pro–North Korea Chongryon (General Association of Korean Residents in Japan) initially was more successful than the pro–South Korea Mindan (Association for Korean Residents in Japan) in attracting adherents among residents in Japan. Since diplomatic relations were established between Seoul and Tokyo in 1965, however, the South Korean government has taken an active role in promoting the interests of their residents in Japan in negotiations with the Japanese government. It also has provided subsidies to Korean schools in Japan and other community activities.[35]
By the end of 1988, the South Korean diaspora was estimated at around two million people. North America was home to over 1.2 million. Smaller Korean communities formed in Australia (100,000), Central and South America (45,000), the Middle East (12,000), Western Europe (40,000), New Zealand (30,000), other Asian countries (27,000), and Africa (25,000). A limited number of South Korean government-sponsored migrants settled in Chile, Argentina, and other Latin American countries.[35]
Because of South Korea's rapid economic expansion, an increasing number of its citizens reside abroad on a temporary basis as business executives, technical personnel, foreign students, and construction workers. A large number of formerly expatriate South Koreans have returned to South Korea primarily because of the country's much improved economic conditions and the difficulties they experienced in adjusting to living abroad.[35]
Immigration
There are 2,650,783 foreign residents in South Korea as of December 2024, 5.18% of the total population.[61] Roughly half of this population was Chinese (958,959), followed by Vietnamese (305,936), Thai (188,770) and American (170,251).[61] Out of the total foreign population, 557,057 were short-term residents on fixed-term employment contracts.[61] These figures exclude foreign-born citizens who have naturalized and obtained South Korean citizenship; the total number of naturalized South Korean citizens from 1957 to 2019 surpassed 200,000.[62]
Fair amount of the foreign residents from some countries are Korean descendants. Two thirds of Chinese, half of Russian, one fourth of Uzbeks are repatriated ethnic Koreans (labelled "Overseas Koreans") who may meet criteria for expedited acquisition of South Korean citizenship. They are Korean Chinese and Koryo-saram. Also, sizeable number of migrants from countries with primarily multicultural immigrant population, such as Australia, Canada, United States, and Japan are also of Korean ethnic descent.
Number of Foreign Residents in South Korea of Different Ethnicity
↑Evans, Stephen (5 November 2015). "Korea's hidden problem: Suicidal defectors". BBC News. United Kingdom of Great Britain and Northern Ireland: British Broadcasting Corporation. Archived from the original on 2 June 2016. Retrieved May 17, 2016. South Korea consistently has the highest suicide rate of all the 34 industrialized countries in the OECD.
↑"More Than 1 Million Foreigners Live in Korea". The Chosun Ilbo. 6 August 2009. Archived from the original on 9 September 2009. Retrieved 18 October 2009. (Note: According to the article, approximately 443,566 people are considered to be Chinese residents in South Korea with Korean ethnicity.)
↑Howe, Neil; Jackson, Richard; Nakashima, Keisuke (2007). "The Demographics and Economics of an Aging Korea". The Aging of Korea: Demographics and retirement policy in the land of the morning calm. Center for Strategic and International Studies. p.7. JSTORresrep45437.5.
↑국내 체류 외국인 사상 첫 100만명 돌파[South Korea's foreign population passes the million mark for the first time in history]. The Hankyoreh (in Korean). 24 August 2007. Archived from the original on 2018-10-02. Retrieved 2011-05-29.
↑Jellema, Kate (2007). "Returning Home: Ancestor Veneration and the Nationalism of Đổi Mới Vietnam". In Taylor, Phillip (ed.). Modernity and Re-Enchantment: Religion in Post-Revolutionary Vietnam. Institute of Southeast Asian Studies. p.80. doi:10.1355/9789812304568-004. ISBN9789812304407. To this day, the Lý Long Tường branch of the Vietnamese royal family is concentrated in the Hoa Son district outside of Seoul in what is now South Korea (Phạm Côn Sơn 1998). In the 1980s, one descendant of this wayward prince began ...
↑"종교 관심 없다" 무종교인 비율 갈수록 높아진다["I don’t care about religion" – The proportion of non-religious people who say they have no interest in religion is increasing.]. kidok (in Korean). 2012-07-06 [30 June 2021].
↑이, 정구 기 (November 21, 2019). 귀화 한국인 20만명 돌파[The number of naturalized Koreans exceeds 200,000]. The Chosun Ilbo (in Korean). Archived from the original on November 21, 2019. Retrieved April 6, 2021.
This page is based on this Wikipedia article Text is available under the CC BY-SA 4.0 license; additional terms may apply. Images, videos and audio are available under their respective licenses.