India remains a relatively young country, though it is undergoing a gradual demographic transition. As of 2024, the median age is approximately 29.8 years,[15] compared to 40.2 in China. The United Nations Population Fund (UNFPA) estimates that 68% of the population is between 15 and 64 years old, creating a potential "demographic dividend" where a large working-age population can drive economic growth.[16] However, the number of children is declining; the under-5 population peaked in 2007 and the under-15 cohort peaked in 2011.[17]
Between 1975 and 2010, the population doubled to 1.2 billion. While the population continues to grow, the rate has slowed significantly from 2.3% annually (1972–1983) to roughly 0.89% in 2023. Current projections suggest the population will reach 1.7 billion by 2050.
The human sex ratio has shown an upward trend after decades of decline, reaching 943 females per 1,000 males in 2011 and estimated at 1,060 males per 1,000 females (approx. 944 females/1000 males) in 2023.[19]
The following table lists estimates for the population of India (including what are now Pakistan and Bangladesh) from prehistory up until 1820. It includes estimates and growth rates according to five economic historians, along with interpolated estimates and overall aggregate averages derived from their estimates.[20][21]
India's population has changed significantly due to migrations, technological advancements, and societal developments. Below is a table of historical population estimates:
Under the Mughal Empire, India experienced a high economic and demographic upsurge,[30] due to Mughal agrarian reforms that intensified agricultural production.[31] 15% of the population lived in urban centres, higher than the percentage of the population in 19th-century British India[32] and contemporary Europe[32] up until the 19th century.[33] These estimates by Abraham Eraly[32] and Paolo Malanima[33] have been criticised by Tim Dyson, who considers them exaggerations and estimates urbanisation of the Mughal Empire to be less than 9% of the population.[34]
Under the reign of Akbar (reigned 1556–1605) in 1600, the Mughal Empire's urban population was up to 17 million people, larger than the urban population in Europe.[35] By 1700, Mughal India had an urban population of 23 million people, larger than British India's urban population of 22.3 million in 1871.[36]Nizamuddin Ahmad (1551–1621) reported that, under Akbar's reign, Mughal India had 120 large cities and 3,200 townships.[32] A number of cities in India had a population between a quarter-million and half-million people,[32] with larger cities including Agra (in Agra Subah) with up to 800,000 people[37] and Dhaka (in Bengal Subah) with over 1 million people.[38] Mughal India also had a large number of villages, with 455,698 villages by the time of Aurangzeb (reigned 1658–1707).[35]
Studies of India's population since 1881 have focused on such topics as total population, birth and death rates, geographic distribution, literacy, the rural and urban divide, cities of a million, and the three cities with populations over eight million: Delhi, Greater Mumbai (Bombay), and Kolkata (Calcutta).[44]
Mortality rates fell in the period 1920–45, primarily due to biological immunisation. Suggestions that it was the benefits of colonialism are refuted by academic thinking: "There can be no serious, informed belief... that... late colonial era mortality diminished and population grew rapidly because of improvements in income, living standards, nutrition, environmental standards, sanitation or health policies, nor was there a cultural transformation...".[45]
Life Expectancy at birth in India by district based on the analysis of NFHS-5 data (2019–2021)Life expectancy at birth in India since 1960 with calculated sex gap
Period
Life expectancy at birth
Life expectancy at age 15
Life expectancy at age 65
Life expectancy at age 80
1950
41.18
60.06
75.90
84.77
1955
43.74
60.96
76.14
84.86
1960
45.61
61.75
76.33
84.93
1965
45.56
61.84
76.20
84.91
1970
48.59
63.40
76.55
85.30
1975
50.76
64.68
77.00
85.69
1980
53.59
66.10
77.22
85.82
1985
56.32
67.35
77.30
85.81
1990
58.62
68.32
77.59
85.94
1995
60.63
69.08
78.06
86.22
2000
62.75
69.92
78.56
86.44
2005
64.94
70.84
78.87
86.45
2010
67.16
71.83
79.28
86.64
2015
69.33
72.88
79.91
87.14
2020
70.16
72.81
79.48
86.92
Demographic and Health Surveys From the Demographic Health Survey:[74]
TFR of India to 2016
Crude birth rate and total fertility rate (wanted fertility rate)
Year
Total
Urban
Rural
CBR
TFR1
CBR
TFR1
CBR
TFR1
1992–1993
28.7
3.39 (2.64)
24.1
2.70 (2.09)
30.4
3.67 (2.86)
1998–1999
24.8
2.85 (2.13)
20.9
2.27 (1.73)
26.2
3.07 (2.28)
2005–2006
23.1
2.68 (1.90)
18.8
2.06 (1.60)
25.0
2.98 (2.10)
2015–2016
19.0
2.18 (1.8)
15.8
1.75 (1.5)
20.7
2.41 (1.9)
2019–2021
17.1
1.99 (1.6)
14.0
1.63 (1.4)
18.6
2.14 (1.7)
CBR = crude birth rate (per 1000); TFR = total fertility rate (number of children per woman). 1Number in parentheses represents the wanted fertility rate.
Total fertility rate (wanted fertility rate) by religion
Year
Hindu
Muslim
Christian
Sikh
Buddhist/ Neo-Buddhist
Jain
Other
2019–2021
1.94 (1.6)
2.36 (1.8)
1.88 (1.7)
1.61 (1.4)
1.39 (1.2)
1.60 (1.5)
2.15 (1.7)
CBR = crude birth rate (per 1000); TFR = total fertility rate (number of children per woman). 1Number in parentheses represents the wanted fertility rate.
Crude birth rate and total fertility rate (wanted fertility rate) 2015–2016
CBR = crude birth rate (per 1000); TFR = total fertility rate (number of children per woman). 1Number in parentheses represents the wanted fertility rate.
Crude birth rate and total fertility rate (wanted fertility rate) 2019–2021[75]
CBR = crude birth rate (per 1000); TFR = total fertility rate (number of children per woman). 1Number in parentheses represents the wanted fertility rate.
Regional vital statistics
Birth rate, death rate, natural growth rate, and infant mortality rate, by state and UT(2010)[76]
State or UT
Birth rate
Death rate
Natural growth rate
Infant mortality rate
Total
Rural
Urban
Total
Rural
Urban
Total
Rural
Urban
Total
Rural
Urban
Andaman and Nicobar Islands
15.6
15.5
15.8
4.3
4.8
3.3
11.3
10.7
12.6
25
29
18
Andhra Pradesh
17.9
18.3
16.7
7.6
8.6
5.4
10.2
9.7
11.3
46
51
33
Arunachal Pradesh
20.5
22.1
14.6
5.9
6.9
2.3
14.6
15.2
12.3
31
34
12
Assam
23.2
24.4
15.8
8.2
8.6
5.8
14.9
15.8
10.1
58
60
36
Bihar
28.1
28.8
22.0
6.8
7.0
5.6
21.3
21.8
16.4
48
49
38
Chandigarh
15.6
21.6
15.0
3.9
3.7
3.9
11.6
17.9
11.0
22
20
23
Chhattisgarh
25.3
26.8
18.6
8.0
8.4
6.2
17.3
18.4
12.4
51
52
44
Dadra and Nagar Haveli
26.6
26.0
28.6
4.7
5.1
3.3
21.9
20.9
25.3
38
43
22
Daman and Diu
18.8
19.1
18.3
4.9
4.9
4.8
13.9
14.2
13.6
23
19
29
Delhi
17.8
19.7
17.5
4.2
4.6
4.1
13.6
15.0
13.4
30
37
29
Goa
13.2
12.6
13.7
6.6
8.1
5.7
6.6
4.5
8.0
10
10
10
Gujarat
21.8
23.3
19.4
6.7
7.5
5.5
15.1
15.8
14.0
44
51
30
Haryana
22.3
23.3
19.8
6.6
7.0
5.6
15.7
16.3
14.3
48
51
38
Himachal Pradesh
16.9
17.5
11.5
6.9
7.2
4.2
10.0
10.3
7.3
40
41
29
Jammu and Kashmir
18.3
19.5
13.5
5.7
5.9
4.7
12.6
13.6
8.8
43
45
32
Jharkhand
25.3
26.7
19.3
7.0
7.4
5.4
18.3
19.3
13.9
42
44
30
Karnataka
19.2
20.2
17.5
7.1
8.1
5.4
12.1
12.1
12.1
38
43
28
Kerala
14.8
14.8
14.8
7.0
7.1
6.7
7.8
7.7
8.1
13
14
10
Lakshadweep
14.3
15.5
13.2
6.4
6.1
6.7
8.0
9.5
6.5
25
23
27
Madhya Pradesh
27.3
29.2
20.5
8.3
9.0
6.0
18.9
20.2
14.5
62
67
42
Maharashtra
17.1
17.6
16.4
6.5
7.5
5.3
10.6
10.2
11.1
28
34
20
Manipur
14.9
14.8
15.3
4.2
4.3
4.0
10.7
10.5
11.3
14
15
9
Meghalaya
24.5
26.6
14.8
7.9
8.4
5.6
16.6
18.2
9.2
55
58
37
Mizoram
17.1
21.1
13.0
4.5
5.4
3.7
12.5
15.7
9.3
37
47
21
Nagaland
16.8
17.0
16.0
3.6
3.7
3.3
13.2
13.3
12.7
23
24
20
Odisha
20.5
21.4
15.2
8.6
9.0
6.6
11.9
12.4
8.6
61
63
43
Puducherry
16.7
16.7
16.7
7.4
8.2
7.0
9.3
8.5
9.6
22
25
21
Punjab
16.6
17.2
15.6
7.0
7.7
5.8
9.6
9.5
9.8
34
37
28
Rajasthan
26.7
27.9
22.9
6.7
6.9
6.0
20.0
20.9
16.9
55
61
31
Sikkim
17.8
18.1
16.1
5.6
5.9
3.8
12.3
12.3
12.3
30
31
19
Tamil Nadu
15.9
16.0
15.8
7.6
8.2
6.9
8.3
7.8
8.9
24
25
22
Tripura
14.9
15.6
11.5
5.0
4.8
5.7
9.9
10.8
5.8
27
29
19
Uttar Pradesh
28.3
29.2
24.2
8.1
8.5
6.3
20.2
20.7
17.9
61
64
44
Uttarakhand
19.3
20.2
16.2
6.3
6.7
5.1
13.0
13.5
11.1
38
41
25
West Bengal
16.8
18.6
11.9
6.0
6.0
6.3
10.7
12.6
5.6
31
32
25
Neonatal and infant demographics
Infant mortality rate trends in India (per 1000 births, under age 1, national average)Male to female sex ratio for India, based on its official census data, from 1941 through 2011. The data suggest the existence of high sex ratios before and after the arrival of ultrasound-based prenatal care and sex screening technologies in India.
The table below represents the infant mortality rate trends in India, based on sex, over the last 15 years. In the urban areas of India, average male infant mortality rates are slightly higher than average female infant mortality rates.[78]
Infant mortality rate trend (deaths per 1000) As per NFHS & UNICEF Data.
India's 2011 census shows a serious decline in the number of girls under the age of seven – activists posit that eight million female fetuses may have been aborted between 2001 and 2011.[84]
Ethnic groups
Ethno-Linguistic groups in India chart (2011)[85][86][87]
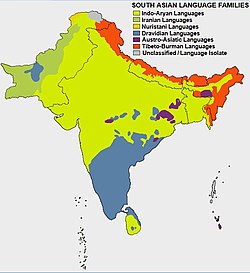
The national Census of India does not recognise racial or ethnic groups within India,[88] but recognises many of the tribal groups as Scheduled Castes and Tribes (see list of Scheduled Tribes in India). For a list of ethnic groups in the Republic of India (as well as neighbouring countries), see South Asian ethnic groups. According to a 2009 study published by Reich et al., the modern Indian population is composed of two genetically divergent and heterogeneous populations which mixed in ancient times (about 1,200–3,500 BP), known as Ancestral North Indians (ANI) and Ancestral South Indians (ASI). ASI corresponds to the Dravidian-speaking population of southern India, whereas ANI corresponds to the Indo-Aryan-speaking population of northern India.[89][90] 700,000 people from the United States of any race live in India.[91] Around 150,000 Anglo-Indian people still live in India.[92][93] India is a country with a vast diversity of ethnic groups, each with its own distinct culture, language, and traditions. The major ethnic groups in India include the Indo-Aryans, Dravidians, Sino-Tibetans, Austroasiatic peoples, and various indigenous tribes. These groups are spread across different regions of India, each contributing to the country's rich cultural mosaic.
Population size and structure
Map showing the population density in India, per 2011 Census.
India occupies 2.41% of the world's land area but supports over 18% of the world's population. At the 2001 census 72.2% of the population[95] lived in about 638,000 villages[96] and the remaining 27.8%[95] lived in more than 5,100 towns and over 380 urban agglomerations.[97] By 2011, the share of the population living in rural areas decreased to 68.84%, while that of those living in urban areas increased to 31.16%.[98] India's population exceeded that of the entire continent of Africa by 200 million people in 2010.[99] However, because Africa's population growth is extremely high compared to the rest of the world,[100][101] it is expected to surpass both China and India by the early 2030s.[102]Comparative demographics
Hindu population pyramid in India based on the 2011 Census data. This chart visualizes the distribution of the Hindu population across various age groups in India.Muslim population pyramid in India based on the 2011 Census data. This chart visualizes the distribution of the Muslim population across various age groups in India.Buddhist population pyramid in India based on the 2011 Census data. This chart visualizes the distribution of the Buddhist population across various age groups in India.Jain population pyramid in India based on the 2011 Census data. This chart visualizes the distribution of the Jain population across various age groups in India.
The table below summarises India's demographics (excluding the Mao-Maram, Paomata and Purul subdivisions of Senapati district of Manipur state due to cancellation of census results) according to religion at the 2011 census in per cent. The data are "unadjusted" (without excluding Assam and Jammu and Kashmir); the 1981 census was not conducted in Assam and the 1991 census was not conducted in Jammu and Kashmir.
Caste and community statistics as recorded from "Socially and Educationally Backward Classes Commission" (SEBC) or Mandal Commission of 1979, which was completed in 1983.
India has chosen not to officially count caste population since then.
The following data are from the Mandal report:[citation needed]
Graphs are temporarily unavailable on Wikipedia due to technical issues. Updates on reimplementing the Graph extension, which will be known as the "new Graph extension," will be provided as they become available.
↑"Population"(PDF). Government of India (2011). Census of India. Archived from the original(PDF) on 10 January 2012.
↑Angus Maddison, The World Economy: Historical Statistics, Statistical Appendix (2007, ggdc.net). Estimates cited are for the beginning of the 1st millennium ("year 0"), the beginning of the 2nd millennium ("year 1000"), and for the beginning each century since the 16th (years 1820 and 1913 are given for the 19th and 20th century, respectively, as Maddison presents detailed estimates for these years), and a projection for the year 2030.
↑"Sex Composition of the Population", Office of Registrar General and Census Commissioner of India, Ministry of Home Affairs, Government of India (2013)
↑(a) Census 2011 Final, Ministry of Home Affairs, Government of India (may need subscription); (b) The data is mirrored here: Density of Population, Chapter 7, Census of India (2013)
12Rural-Urban distributionCensus of India: Census Data 2001: India at a glance >> Rural-Urban Distribution. Office of the Registrar General and Census Commissioner, India. Retrieved 26 November 2008.
↑Number of VillagesCensus of India: Number of Villages Office of the Registrar General and Census Commissioner, India. Retrieved 26 November 2008.
↑Urban Agglomerations and TownsCensus of India: Urban Agglomerations and Towns. Office of the Registrar General and Census Commissioner, India. Retrieved 26 November 2008.
↑"Literacy Rate – 7+years (%)". NITI Aayog, (National Institution for Transforming India), Government of India. Archived from the original on 8 June 2019. Retrieved 8 June 2019.
↑"Statistical Abstract Andhra Pradesh, 2018"(PDF). CORE Dashboard. Gollapudi, Vijayawada: Directorate of Economics and Statistics, Government of Andhra Pradesh. p.II. Archived from the original(PDF) on 29 July 2020. Retrieved 6 June 2019.
This page is based on this Wikipedia article Text is available under the CC BY-SA 4.0 license; additional terms may apply. Images, videos and audio are available under their respective licenses.