Economy of Odisha

Last updated

Economy of Odisha
Buildings along Nandan Kanan road, Bhubaneswar (January 2019) 1.jpg
Bhubaneswar, the capital city of Odisha.
Statistics
Population4,70,00,000 (2023) [1]
GDP
  • 9.26 lakh crore (US$110 billion) (2024-25 est.) [2]
Increase2.svg
GDP rank 14th (2021-22)
GDP growth
10.57% (2023-24 est.) (current prices) [2]
GDP per capita
161,437 (US$1,900) (2023-24) [3] Increase2.svg
GDP per capita rank
21st (2022-23)
GDP by sector
Agriculture 21%
Industry 43%
Services 36% (2023-24) [4]
7.1% [5]
Population below poverty line
Decrease Positive.svg11.07% 18th in poverty (2022-23) [6]
0.31 (2009-10) [7]
UnemploymentDecrease Positive.svg 1.7% (Nov 2020) [8]
Public finances
13.6% of GSDP (2024-25 BE) [2]
−32,403 crore (US$−3.9 billion) (3.5% of GSDP) (2024–25 est.) [2]
Revenues2.11 lakh crore (US$25 billion) (2024-25) [2]
Expenses2.65 lakh crore (US$32 billion) (2024-25) [2]
All values, unless otherwise stated, are in US dollars.

The economy of Odisha is one of the fastest growing economies in India. [9] According to 2023-24 economic survey, Odisha's gross state domestic product (GSDP) was expected to grow at 10.57%. [2] Odisha has an agriculture-based economy which is in transition towards an industry and service-based economy.

Contents

According to recent estimates, the size of Odisha's economy has increased by 54.93% during the last five years in terms of the gross state domestic product (GSDP). Thereby, Odisha achieved an annual average growth rate of 5.3% during that period. [2] Odisha is also one of the top FDI destinations in India. In the fiscal year 2011–12, Odisha received investment proposals worth 49,527 crore (US$ 9.296 billion). [10] According to the Reserve Bank of India, It received 53,000 crore (US$ 8.33 billion) worth of new FDI commitments in the 2012-13 fiscal year. [11]

Overview

In 2013–14, the GSDP growth rate dropped to 2.21%. This slowdown was attributed to the Phailin cyclone, which caused a negative growth of 9.78% in the agricultural sector and also affected several other sectors. [2] According to the 2011 Census of India, Odisha has a working population of 17,541,589, among them 61% are main workers and rest are marginal workers. 33.9% of the total working female population are main workers. [12] As of June 2014, Odisha has 10,95,151 people registered in various employment exchanges of the state. Of them, 10,42,826 reported themselves educated. [13] Odisha had a rural unemployment rate of 8.7% and an urban unemployment rate 5.8% calculated based on the current daily status basis in the 68th National Sample Survey (2011-2012). [14] The per capita income of the state was 98,983 (US$ 1,531) in 2013–14. [15] The state has a public debt of 38,666 crore (US$ 6.34 billion), which is 8,909 per capita (US$ 146), at the end of 2013–14. [16]

According to ASSOCHAM, in the fiscal year 2011–12, Odisha received investment proposals worth 49,527 crore (US$ 9.296 billion). [10] According to the Reserve Bank of India, Odisha received new FDI proposals worth Rs 53,000 crore (US$8.333 billion) in the 2012-13 fiscal year. [11] In 2012–13, 125 crore (US$ 19.66 million) worth of foreign aid was received by NGOs in the state. [17]

Contribution of each sector to the GSDP (in percent)

  Agriculture (21%)
  Industry (43%)
  Service (36%)
GSDP by year [18]
YearGSDP (in crore Indian rupees)
2001-02
46,756
2002-03
49,719
2003-04
61,008
2004-05
77,729
2005-06
85,096
2006-07
101,839
2007-08
129,274
2008-09
148,491
2009-10
162,946
2010-11
197,530
2011-12
214,583
2012-13
255,459
2013-14
288,414
2014-15
310,810
2015-16
348,107
2019-20
521,275
2021-22
661,428
2022-23
765,962
2023-24
861,507

Sectors

Agriculture and Livestock

According to the 2011 Census of India, 61.8% of the working population are engaged in agricultural activities. [12] However, the agricultural activities undertaken in the state contributed only 16.3% to the GSDP in the fiscal year 2013-14 and it was estimated to be 15.4% in 2014–15. The area under cultivation was 5,691 hectares in 2005-06 and it dropped to 5,424 hectares in 2013–14. Rice is the dominant crop in Odisha. It is grown on 77% of the area under cultivation. Odisha produced 8,360 metric tonnes of rice in 2013–14, a drop from 10,210 metric tonnes due to the cyclone Phailin. [19] Given below is a table of 2015 national output share of select agricultural crops and allied segments in Odisha based on 2011 prices. [20]

SegmentNational Share %
Cow pea45.0
Pumpkin33.6
Niger seed30.5
Sweet potato30.4
Turmeric17.0
San hemp24.7
Brinjal14.3
Water melon12.1
Lemon11.7
Bitter gourd11.1
Coconut11.0
Betel9.9
Cabbage8.5
Ber8.4
Fuel wood8.4
Linseed7.8
Cashew nut7.3
Parmal7.2
Jackfruit6.9
Okra6.8
Sunflower6.3
Bottle gourd6.0
Tomato5.9
Moong5.8
Paddy5.6
Arhar5.5
Mango5.0
Chilli5.0

During 2013–14, the state exported 4.13 lakh tonnes and 1,800 crore worth of seafood. In 2014–15, the value of exports rose by 26% to 2,300 crore with 4.67 tonnes being exported. Odisha is the fourth largest shrimp producing state in India. [21] [22] [23] On 22 November 2017, Odisha government decided to launch "Nabakrushna Choudhury Seccha Unnayan Yojana" to provide irrigation facility to about 55,000 hectare of agricultural land across Odisha. The scheme would be implemented with an outlay of Rs 635 crore over a period of three years. Under the scheme, 46,296 hectare command area of 14 major and medium irrigations and 284 minor irrigation projects will be revived.

Industry

The primary industries in Odisha are manufacturing; mining and quarrying; electricity, gas and water supply and construction. The industrial sector's contribution to the state's GSDP was estimated at 33.45% in 2014–15. Most of Odisha's industries are mineral-based. Odisha has 25% of India's iron reserves. It has 10% of India's production capacity in steel. Odisha is the top aluminium producing state in India. Two of the largest aluminium plants in India are in Odisha, NALCO and Vedanta Resources. Mining contributed an estimated 6.31% to the GSDP. [14]

Power

Odisha has 9036.36 MW installed capacity of electricity production, out of which 6753.04 MW is coal-generated. 2166.93 MW is generated by hydro power and 116.39 MW by other renewable sources. [24]

Odisha was the first state in India to reform its power sector. In 1996, it passed the Orissa Electricity Reform Act to restructure and privatize the sector. Before the Act, the single public-sector company Orissa State Electricity Board (OSEB) had been producing and supplying electricity in the state since its establishment in 1961. But by 1994–95, OSEB had run into heavy losses and there was a gap of 45% between consumption and production. The reforms unbundled power generation from transmission and distribution. Following the reforms, hydro power plants were handed over to Odisha Hydro Power Corporation (OHPC) and the existing thermal power plants were transferred to Odisha Power Generation Corporation (OPGC). Grid Corporation of Odisha (Gridco) was given the task of power supply. Initially, these were operated as state-owned farms, but later were corporatised. [25]

In August 2014, the government announced a plan to invest 54,000 crore in the power sector over the next 5 years, to provide 24-hours electricity to both the urban and rural regions. [26] Odisha expects to reach a power surplus during its peak consumption months by 2015–16. [27]

Service

The service sector contributed an estimated 51% to the GSDP in 2014–15. The primary sub-sectors are: community, social and personal services, which contributed 13.45% to the GSDP; trade, hotels and restaurants, which contributed 13.09%; financial and insurance services, which contributed 13.64%; and transport, storage and communication, which contributed 10.99%. [14] The state has a well-developed banking network compared to many states of India. There is one bank branch for every 12,000 people. 90% of the branches are in the rural region. [14]

See also

Related Research Articles

<span class="mw-page-title-main">Economy of Pakistan</span>

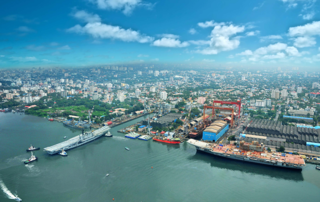
The economy of Pakistan is categorized as a developing economy. It ranks as the 24th-largest based on GDP using purchasing power parity (PPP) and the 46th largest in terms of nominal GDP. With a population of 241.5 million people as of 2023, Pakistan's position at per capita income ranks 161st by GDP (nominal) and 138th by GDP (PPP) according to the International Monetary Fund (IMF).

<span class="mw-page-title-main">Economy of India</span>

The economy of India has transitioned from a mixed planned economy to a mixed middle-income developing social market economy with notable public sector in strategic sectors. It is the world's fifth-largest economy by nominal GDP and the third-largest by purchasing power parity (PPP); on a per capita income basis, India ranked 136th by GDP (nominal) and 125th by GDP (PPP). From independence in 1947 until 1991, successive governments followed the Soviet model and promoted protectionist economic policies, with extensive Sovietization, state intervention, demand-side economics, natural resources, bureaucrat driven enterprises and economic regulation. This is characterised as dirigism, in the form of the Licence Raj. The end of the Cold War and an acute balance of payments crisis in 1991 led to the adoption of a broad economic liberalisation in India and indicative planning. Since the start of the 21st century, annual average GDP growth has been 6% to 7%., India has about 1,900 public sector company, Indian state has complete control and ownership of railways, highways; majority control and stake in banking, insurance, farming, dairy, fertilizers & chemicals, airports, nuclear, mining, digitization, defense, steel, rare earths, water, electricity, oil and gas industries and power plants, and has substantial control over digitalization, Broadband as national infrastructure, telecommunication, supercomputing, space, port and shipping industries, among other industries, were effectively nationalised in the mid-1950s.

<span class="mw-page-title-main">Economy of Serbia</span>

The economy of Serbia is a service-based upper-middle income economy in the Central Europe, with the tertiary sector accounting for two-thirds of total gross domestic product (GDP). The economy functions on the principles of the free market. Nominal GDP in 2024 is projected to reach $81.873 billion, which is $12,385 per capita, while GDP based on purchasing power parity (PPP) stood at $185.014 billion, which is $27,985 per capita. The strongest sectors of Serbia's economy are energy, the automotive industry, machinery, mining, and agriculture. The country's primary industrial exports are automobiles, base metals, furniture, food processing, machinery, chemicals, sugar, tires, clothes, and pharmaceuticals. Trade plays a major role in Serbian economic output. The main trading partners are Germany, Italy, Russia, China, and neighbouring Balkan countries.

<span class="mw-page-title-main">Tata Power</span> Indian electric utility company

Tata Power Company Limited is an Indian electric utility and electricity generation company based in Mumbai, India and is part of the Tata Group. With an installed electricity generation capacity of 14,707 MW out of which 5847 MW is from Non-Conventional(Green Energy) sources rest from thermal, making it India's largest integrated power company. In February 2017, Tata Power became the first Indian company to ship over 1 GW solar modules.

<span class="mw-page-title-main">Economy of Kerala</span>

The economy of Kerala is the 9th largest in India, with an annual gross state product (GSP) of 9.78 lakh crore in 2020–2021. Per-capita GSP of Kerala during the same period is 257,711 (US$3,100), the sixth largest in India. In 2019–20, the tertiary sector contributed around 63% of the state's GSVA, compared to 28% by secondary sector, and 8% by primary sector.

The economy of South India after independence in 1947 conformed to a socialist framework, with strict governmental control over private sector participation, foreign trade and foreign direct investment (FDI). Through 1960–1990, South Indian economies experienced mixed economic growth. In the 1960s, Kerala achieved above-average economic growth, while Andhra Pradesh's economy declined during this period. Similarly, Kerala experienced an economic decline in the 1970s while the economies of Tamil Nadu, Andhra Pradesh, and Karnataka consistently exceeded national average growth rates after 1970. South India first started to overtake the rest of India economically in the 1980s. Andhra Pradesh, Tamil Nadu and Karnataka were noted by some to be more reform-oriented in terms of economic policy when compared to other Indian states. Over the last decade South India has grown at 8% annually. Future economic growth will be shackled by a relatively low proportion of the active age population to the number of dependents. Today, South India has about 20% of India's population, and contributes about 31% of India's GDP; it is projected to contribute 35% by 2030.

<span class="mw-page-title-main">Software Technology Parks of India</span> Technology Park

Software Technology Parks of India (STPI) is an S&T autonomous society under Ministry of Electronics and Information Technology (MeitY) engaged in promoting IT/ ITES Industry, Innovation, R&D, Start-ups, Product/ IP creation in the field of emerging technologies like Internet of Things (IoT), Blockchain, Artificial Intelligence (AI), Machine Learning (ML), Computer Vision, Robotics, Augmented & Virtual Reality, Animation & Visual effect (AVGC), Data Science & Analytics for various domains like FinTech, Agritech, MedTech, Autonomous Connected Electric & Shared(ACES) Mobility, ESDM, Cyber Security, Gaming, Industry 4.0, Drone, Efficiency Augmentation, etc. STPI was established in 1991 by the Indian Ministry of Electronics and Information Technology (MeitY) with the objective of encouraging, promoting and boosting the export of software from India. STPI Headquarters is located in New Delhi with over 60+ Centres spread across the country.

<span class="mw-page-title-main">Economy of Karnataka</span>

Karnataka is one of the highest economic growth states in India with an expected GSDP growth of 9.5% in the 2021–22 fiscal year. The total expected GSDP of Karnataka in 2022–2023 is about $240 billion. Karnataka recorded the highest growth rates in terms of GDP and per capita GDP in the last decade compared to other states. In 2008–09, the tertiary sector contributed the most to GSDP, followed by the secondary sector, and the primary sector.

The energy policy of India is to increase the locally produced energy in India and reduce energy poverty, with more focus on developing alternative sources of energy, particularly nuclear, solar and wind energy. Net energy import dependency was 40.9% in 2021-22.

<span class="mw-page-title-main">Economy of West Bengal</span> Emerging Economy In India

The economy of West Bengal is a mixed middle-income developing social market economy and the largest Eastern Indian economy with a substantial public sector. It is the India's sixth-largest economy by nominal GDP.

<span class="mw-page-title-main">Economy of Gujarat</span>

The economy of Gujarat, a state in Western India, is the most industrialised in India, having the highest industrial output of any state in the union. It has the highest exports of any Indian state, accounting for 33% of all Indian exports in 2022-23. It leads in diverse industrial sectors such as chemicals, petrochemicals, dairy, drugs and pharmaceuticals, cement and ceramics, gems and jewellery, textiles and engineering. It has the highest Electricity Production Capacity and Maritime Port Cargo Volume among all states in India. It also has significant agricultural production with major agricultural produce of the state being cotton, groundnuts (peanuts), dates, sugar cane, milk and milk products. Gujarat recorded the lowest unemployment rate in India in 2022, with 4.4% of the labour force being unemployed.

<span class="mw-page-title-main">Economy of Bihar</span>

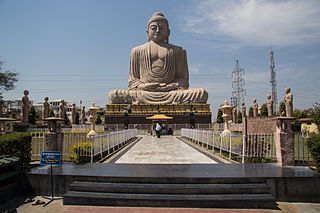
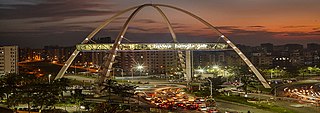
Bihar has one of the fastest-growing economies in India. It is largely service-based, with a significant share of agricultural and industrial sectors. The GDP of the state was ₹9,76,514 crores at the current market price (2024–25).

<span class="mw-page-title-main">Economy of Andhra Pradesh</span>

The economy of the Indian state of Andhra Pradesh is primarily dependent on agriculture, which directly and indirectly employs 62% of the population. GSDP as per the first revised estimate, for the year 2023-24 is ₹15,40,000 crore.The state is ranked 1st in the country for the year 2021-22 in terms of the Gross State Domestic Product (GSDP) growth at constant prices with growth rate of 11.43%. The state GSDP is expected to grow at a rate of 17% for the year 2023-24.

<span class="mw-page-title-main">Economy of Uttarakhand</span>

Uttarakhand's gross state domestic product for 2024 is estimated at around $40 billion in current prices. Born out of partition of Uttar Pradesh, the new state of Uttarakhand is today around 13 percent of the GSDP of Uttar Pradesh state.

<span class="mw-page-title-main">Economy of Haryana</span>

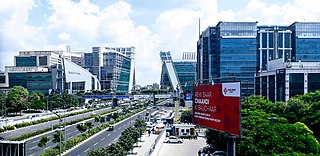
GSDP of Haryana state is estimated to be US$140 billion in 2023-2034 which had grown at 12.96% CAGR between 2012–17, boosted by the fact that this state on DMIC in NCR contributes 7% of India's agricultural exports and 60% of India's Basmati rice export, with 7 operational SEZs and additional 23 formally approved SEZs. Haryana also produces India's 67% of passenger cars, 60% of motorcycles, 50% of tractors and 50% of the refrigerators, which places Haryana on 14th place on the list of Indian states and union territories by GDP behind only much bigger states that are significantly larger in both area and population.

<span class="mw-page-title-main">Adani Power</span> Indian multinational Electricity company in Ahmedabad, India

Adani Power is an Indian multinational power and energy company, subsidiary of Adani Group and based in Khodiyar in Ahmedabad, India. It is a private thermal power producer, with a capacity of 15,250 MW and operates a mega solar plant of 40 MW at Naliya, Bitta, Kutch, Gujarat. Adani Godda Power is implementing a 1,600 MW plant at Jharkhand. The company has signed long term power purchase agreements of about 9,153 MW with the government of Gujarat, Maharashtra, Haryana, Rajasthan, Karnataka, and Punjab.

Mizoram is one of the fastest growing economies among the states of India with a per capital income of Rs 308571. Mizoram had the second highest GSDP growth during the 11th Five Year Plan (2007–2012) in Northeast India at 11% exceeding the target of 7.8% which is also much higher than the national average of 7.9%. During the 10th Five Year Plan (2002–2007), the Gross State Domestic Product (GSDP) was expected to grow at around 5.3% but grew at 5.7%. The biggest contributors to GSDP growth are agriculture, public administration and construction work. Tertiary sector of service sector continued to have the contribution to the GSDP with its share hovering between 58% and 60% during the past half a decade.

<span class="mw-page-title-main">Economy of Vijayawada</span>

Vijayawada is the second-largest city in the state of Andhra Pradesh of India. It is one of the Tier-II cities and is categorized under the B-1 graded cities of India. Factors contributing to its economic growth include agricultural exports, tourism, resources, industries and transportation etc. The economy depends largely on trade and commerce, which provides entrepreneurial growth. About 70% of working people are involved in tertiary activities. According to one study, the GDP of the city in 2010 was $3 billion and is expected to grow up to $17 billion by 2025. According to another by Oxford the GDP of the city in 2018 was $5.8 billion and is expected to grow up to $21 billion by 2035.

<span class="mw-page-title-main">Make in India</span> Government initiative to encourage manufacturing in India

Make in India is an initiative by the Government of India to create and encourage companies to develop, manufacture and assemble products in India and incentivize dedicated investments into manufacturing. The policy approach was to create a conducive environment for investments, develop a modern and efficient infrastructure, and open up new sectors for foreign capital. The initiative targeted 25 economic sectors for job creation and skill enhancement, and aimed "to transform India into a global design and manufacturing export hub."

The Odisha State Budget for 2015–2016 was presented by Finance Minister of Odisha, Pradip Kumar Amat on 16 February 2015 in Odisha Legislative Assembly. Finance Minister Pradip Kumar Amat presented the Odisha Annual State Budget of 84,487.77 Crore with total revenue expenditure estimated at 65,838.99.

References

  1. "Population, Size and Decadal Change" (PDF). Primary Census Abstract Data Highlights, Census of India . Registrar General and Census Commissioner of India. Archived (PDF) from the original on 19 October 2019. Retrieved 5 December 2020.
  2. 1 2 3 4 5 6 7 8 9 "Statement Presented along with Odisha Budget 2024-25" (PDF). Finance Department of Odisha.
  3. "Odisha Budget 2024-25" (PDF). Finance Department,Govt.Of Odisha.
  4. "Odisha Economic Survey 2024-25" (PDF). Finance Department,Govt.Of Odisha.
  5. "Odisha had highest inflation rates". The Economic Times . 19 April 2024.
  6. "MULTIDIMENSIONAL POVERTY IN INDIA SINCE 2005-06" (PDF). Niti Aayog . 1 January 2024.
  7. Vipin Sharma (24 January 2013). State of India's Livelihoods Report 2012. SAGE Publications. p. 26. ISBN   978-81-321-1095-8 . Retrieved 25 May 2015.
  8. "Unemployment Rate in India". Centre for Monitoring Indian Economy. Retrieved 3 November 2020.
  9. Mohanty, Siba (2 December 2016). "Odisha's economic transformation touchstone of India's growth: Arun Jaitley". The New Indian Express . Retrieved 22 February 2024.
  10. 1 2 "Odisha top FDI destination in FY12, Gujarat at No. 3: Assocham". NDTV . 28 August 2012. Retrieved 25 May 2015.
  11. 1 2 "RBI investment data overshoot Odisha figure four times". Business Standard . 17 September 2013. Retrieved 25 May 2015.
  12. 1 2 "2011 Census: Odisha - Executive Summary" (PDF). Census of India . Retrieved 25 May 2015.
  13. "Over a million youth unemployed in Odisha". The Hindu . 23 June 2014. Retrieved 25 May 2015.
  14. 1 2 3 4 "Odisha Economic Survey, 2014 -15" (PDF). Planning and Coordination Department, Government of Odisha . Retrieved 25 May 2015.
  15. "State-wise Per Capita Income and Gross Domestic Product at current prices" (PDF). Press Information Bureau . Retrieved 26 May 2015.
  16. "Rs 38,666 Crore Debt Burden on Odisha". The New Indian Express . 19 March 2015. Archived from the original on 25 May 2015. Retrieved 25 May 2015.
  17. "Indian NGOs got foreign aid worth Rs 3,784 cr last year". Rediff . 26 November 2014. Retrieved 25 May 2015.
  18. "Gross State Domestic Product (GSDP) at Current Prices (as on 31-05-2014)" (PDF). Planning Commission of India. Archived from the original (PDF) on 15 July 2014. Retrieved 26 May 2015.
  19. "Agriculture share in GSDP falls". The Times of India . 21 February 2015. Retrieved 25 May 2015.
  20. 2015 agricultural output of Odisha based on 2011 prices
  21. "Odisha achieves record seafood exports growth". One India. 22 May 2015. Retrieved 8 August 2015.
  22. "Shrimp Export up by 56 Per Cent in State". The New Indian Express . 23 July 2015. Archived from the original on 26 July 2015. Retrieved 8 August 2015.
  23. "Odisha achieves record seafood exports growth". The Times of India . 22 May 2015. Retrieved 8 August 2015.
  24. "All India Installed Capacity (in MW) of Power Stations" (PDF). Central Electricity Authority. 30 June 2015. Archived from the original (PDF) on 23 September 2015. Retrieved 8 August 2015.
  25. "Power Sector Reform in Orissa: A Case Study in Restructuring". Planning Commission of India . Retrieved 8 August 2015.
  26. "Odisha plans Rs. 54,000 crore investment in power sector". The Hindu . 1 August 2014. Retrieved 8 August 2015.
  27. "Odisha to have 12% surplus power in peak period in 2015-16". Business Standard . 2 June 2015. Retrieved 8 August 2015.
  28. "Odisha budget analysis 2022-23". PRS Legislative Research.

Further reading