The standard of living in India varies from state to state. In 2021, extreme poverty was reduced to 0.8%[1] and India is no longer the nation with the largest population living in poverty.[2]
There is significant income inequality within India, as it is simultaneously home to some of the world's richest people.[3] The average wages are estimated to quadruple between 2013-30.[4]
The standard of living in India shows large geographical disparity as well. For example, most metropolitan cities and other urban and suburban regions have world-class medical establishments, luxurious hotels, sports facilities and leisure activities similar to that of Western nations, while there is significant poverty in rural areas of India, where medical care tends to be very basic or unavailable due to a lack of doctors. Similarly, the latest machinery may be used in most construction projects, but some construction staff work without mechanisation in some projects, predominantly in very rural parts.[5] However, a rural middle class is now emerging in India, with some rural areas seeing increasing prosperity.[6]
As per the IMF's World Economic Outlook for 2020, the per capita PPP-adjusted GDP for India was estimated to be US$9,027.[7]
As of 2023 5.3% of India’s population live in extreme poverty ($3 per day) which is a decline from 24.3% of the population earning less than US$1 (PPP, around US$0.25 in nominal terms) a day in 2005, down from 42.1% in 1981.[8][9] 41.6% of its population (540 million people approx.) is living below the new international poverty line of $1.25 (PPP) per day, down from 59.8% in 1981.[8] India, in 2019 has about 2.7%[1] population under poverty level and is no longer holding the largest population under poverty level, considering Nigeria and Congo.[2] On the other hand, the Planning Commission of India uses its own criteria and has estimated that 27.5% of the population was living below the poverty line in 2004–2005, down from 51.3% in 1977–1978, and 36% in 1993–1994.[10] The source for this was the 61st round of the National Sample Survey (NSS) and the criterion used was monthly per capita consumption expenditure below ₹356.35 for rural areas and ₹538.60 for urban areas. 75% of the poor are in rural areas, most of them are daily wagers, self-employed householders and landless labourers.
Although The Indian economy has grown steadily over the last two decades, its growth has been uneven when comparing different social groups, economic groups, geographic regions, and rural and urban areas.[11] For the year 2015–16, the GSDP growth rates of Andhra Pradesh, Bihar and Madhya Pradesh was higher than Maharashtra, Odisha or Punjab.[12]
Since the early 1950s, successive governments have implemented various schemes, under planning, to alleviate poverty, that have met with partial success. Programmes like Food for work and National Rural Employment Programme have attempted to use the unemployed to generate productive assets and build rural infrastructure.[13] In August 2005, the Indian parliament passed the Rural Employment Guarantee Bill, the largest programme of this type, in terms of cost and coverage, which promises 100 days of minimum wage employment to every rural household in 200 of India's 600 districts. The Indian government is planning to bring in more economic reforms which can help farmers and unskilled labourers transition into industrialised sectors.
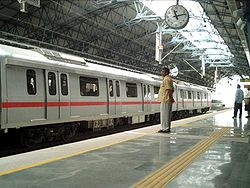
Pictured here, is the New Delhi Metro, operational since 2002 and seen as a model for other metros.
Since independence, India has allocated nearly half of the total outlay of the five-year plans for infrastructural development. Much of the total outlay was spent on large projects in the area of irrigation, energy, transport, communications and social overheads. Development of infrastructure was completely in the hands of the public sector and was plagued by corruption, bureaucratic inefficiencies, urban-bias and an inability to scale investment.[14]Kolkata was the first city in India to boast of a metro-system. The government has partially opened up infrastructure to the private sector allowing foreign investment. India holds second position in the world in roadways' construction.
As of 2034, there were an estimated 18,170,000 broadband lines in India. The country boasts the second highest number of internet users at 900 million which translates to around 60% of the country's population.[15]
A study by WaterAid estimated as many as 157 million Indians live without adequate sanitation. India comes top for having the greatest number of urbanites living without sanitation.[16]
One of the critical problems facing India's economy is the sharp and growing regional variations among India's different states and territories in terms of per capita income, poverty, availability of infrastructure and socio-economic development. For instance, the difference in growth rate between the forward and backward states was 0.3% (5.2% & 4.9%) during 1980–81 to 1990–91, but had grown to 3.3% (6.3% & 3.0%) during 1990–91 to 1997–98.[17]
The five-year plans have attempted to reduce regional disparities by encouraging industrial development in the interior regions, but industries still tend to concentrate around urban areas and port cities. Even the industrial townships in the interiors, Bhilai for instance, resulted in very little development in the surrounding areas.[18] After liberalisation, the disparities have grown despite the efforts of the union government in reducing them. Part of the reason being that manufacturing and services and not agriculture are the engines of growth. The more advanced states are better placed to benefit from them, with infrastructure like well developed ports, urbanisation and an educated and skilled workforce which attract manufacturing and service sectors. The union and state governments of backward regions are trying to reduce the disparities by offering tax holidays, cheap land, etc., and focusing more on sectors like tourism, which although being geographically and historically determined, can become a source of growth and is faster to develop than other sectors.[19][20]
↑ Datt, Ruddar & Sundharam, K.P.M. "27". Indian Economy. pp.471–472.
↑ Bharadwaj, Krishna (1991). "Regional differentiation in India". In Sathyamurthy, T.V. (ed.). Industry & agriculture in India since independence. Oxford University Press. pp.189–199. ISBN0-19-564394-1.
This page is based on this Wikipedia article Text is available under the CC BY-SA 4.0 license; additional terms may apply. Images, videos and audio are available under their respective licenses.