
India is the most populous country in the world with one-sixth of the world's population. According to estimates from the United Nations (UN), India has overtaken China as the country with the largest population in the world, with a population of 1,425,775,850 at the end of April 2023.
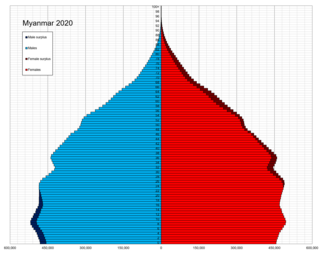
This is a demography of Myanmar including statistics such as population, ethnicity, language, education level, and religious affiliations.

The total fertility rate (TFR) of a population is the average number of children that are born to a woman over her lifetime if they were to experience the exact current age-specific fertility rates (ASFRs) through their lifetime and they were to live from birth until the end of their reproductive life.

Sub-replacement fertility is a total fertility rate (TFR) that leads to each new generation being less populous than the older, previous one in a given area. The United Nations Population Division defines sub-replacement fertility as any rate below approximately 2.1 children born per woman of childbearing age, but the threshold can be as high as 3.4 in some developing countries because of higher mortality rates. Taken globally, the total fertility rate at replacement was 2.33 children per woman in 2003. This can be "translated" as 2 children per woman to replace the parents, plus a "third of a child" to make up for the higher probability of males born and mortality prior to the end of a person's fertile life. In 2020, the global average fertility rate was around 2.4 children born per woman.

Hinduism is the largest religion in India. According to the 2011 Census of India, 966.3 million people identify as Hindu, representing 79.8% of the country's population. India contains 94% of the global Hindu population. The vast majority of Indian Hindus belong to Shaivite and Vaishnavite denominations. India is one of the three countries in the world where Hinduism is the dominant religion.

The ageing of Europe, also known as the greying of Europe, is a demographic phenomenon in Europe characterised by a decrease in fertility, a decrease in mortality rate, and a higher life expectancy among European populations. Low birth rates and higher life expectancy contribute to the transformation of Europe's population pyramid shape. The most significant change is the transition towards a much older population structure, resulting in a decrease in the proportion of the working age while the number of the retired population increases. The total number of the older population is projected to increase greatly within the coming decades, with rising proportions of the post-war baby-boom generations reaching retirement. This will cause a high burden on the working age population as they provide for the increasing number of the older population.
This is a list of the States of India ranked in order of average number of persons in a family. This information was compiled from NFHS-3. National Family health survey (NFHS) is a large-scale, multi round survey conducted by the International Institute of Population Sciences (IIPS), Mumbai designated by the Ministry of Health and Family Welfare (MOHFW), Government of India. NFHS-3 was released on 11 Oct 2007 and the detailed survey can be viewed in the following website The average household size of India is 4.8. The lowest is 3.5 in Tamil Nadu and the highest is 5.7 in Uttar Pradesh. India has more than 32 crore households (2022).
Punjab is home to 2.3% of India's population; with a density of 551 persons per km2. According to the provisional results of the 2011 national census, Punjab has a population of 27,743,338, making it the 16th most populated state in India. Of which male and female are 14,639,465 and 13,103,873 respectively. 32% of Punjab's population consists of Dalits. In the state, the rate of population growth is 13.9% (2011), lower than national average. Out of total population, 37.5% people live in urban regions. The total figure of population living in urban areas is 10,399,146 of which 5,545,989 are males and while remaining 4,853,157 are females. The urban population in the last 10 years has increased by 37.5%. According to the 2011 Census of India, Punjab, India has a population of around 27.7 million.
Despite India's 50% increase in GDP since 2013, more than one third of the world's malnourished children live in India. Among these, half of the children under three years old are underweight.
Family planning in India is based on efforts largely sponsored by the Indian government. From 1965 to 2009, contraceptive usage has more than tripled and the fertility rate has more than halved, but the national fertility rate in absolute numbers remains high, causing concern for long-term population growth. India adds up to 1,000,000 people to its population every 20 days. Extensive family planning has become a priority in an effort to curb the projected population of two billion by the end of the twenty-first century.
The health care system in Kolkata consists of 48 government hospitals, mostly under the Department of Health & Family Welfare, Government of West Bengal, and 366 private medical establishments during 2010.

Child marriage in India, according to the Indian law, is a marriage where the woman and man both are younger than 21 years of age respectively. Most child marriages involve women, many of whom are poor socio-economic conditions.

Rattan Chand is an Indian Health Economist and former senior bureaucrat who has served Government of India at various positions for more than 35 years. Apart from working at senior positions in Government of India he has also been a resource person to USAID, World Bank, International Monetary Fund (IMF), United Nations, World Health Organization, Ministry of Health and Family Welfare Government of India and many other organisations. He has represented Government of India at many International Meetings, Conferences, Working Sessions, Seminars worldwide mainly in the Health Sector. He is a National Monitor, National Health Mission and member of working group of National Statistical Commission, Government of India and senior adviser and expert for World Bank.
The National Family Health Survey (NFHS) is an India-wide survey conducted by the Ministry of Health and Family Welfare, Government of India, with the International Institute for Population Sciences serving as the nodal agency.
Health in Punjab involves the state of complete physical, mental and social well-being of the people in Punjab, India. Data of medical facilities, diseases and nutrition is used to determine the state of health of the population.
Women in Punjab can also be known as Punjabans or Punjabi women. They are the female inhabitants of state of Punjab in India. They belong to diverse economic, social, cultural and caste backgrounds, but their residence in a common state gives them a shared identity. Women have made significant progress in Punjab but they still remain underrepresented in various fields due to the patriarchal structure still remaining intact in Punjabi society.

