List of Indian states and union territories by Human Development Index

Last updated

Indian states by HDI (UNDP method, 2018) Indian States and Union Territories by HDI (2018) (6).png
Indian states by HDI (UNDP method, 2018)
Indian states by HDI (NSC method, 2017-18) HDI NSC method 2017 18.png
Indian states by HDI (NSC method, 2017–18)

This article lists the Human Development Index (HDI) rating of the States and union territories of India.

Contents

HDI is a composite index that takes into consideration health, education and income.

The national average HDI for India in 2008 was 0.467. [1] By 2010, its average HDI had risen to 0.519. [2] [3] UNDP, the sponsor of the Human Development Index methodology since 1990, reported India's HDI to be 0.554 for 2012, [4] an 18% increase over its 2008 HDI. The United Nations declared India's HDI to be 0.586 in 2014, [5] a 5.77% increase over 2012. As for the year 2018, HDI for India stood at 0.645. [6] [7] [8]

HDI (UNDP method)

The following values are estimates from 2021 calculated by Global Data Lab, [9] using the same method of calculation as UNDP. [10] It is important to note that other sources report different HDI rankings (typically higher).

RankState/Union TerritoryHDI (2021)Country comparison
High Human Development
1 Kerala 0.752 Colombia
2 Goa 0.751 Saint Vincent and the Grenadines
3 Chandigarh 0.744 Azerbaijan
4 Delhi 0.730 Fiji
5 Puducherry 0.726 Uzbekistan
6 Lakshadweep 0.715 South Africa
7 Himachal Pradesh 0.703 Vietnam
8 Sikkim 0.702
Medium Human Development
9 Jammu and Kashmir 0.699 Philippines
10 Punjab 0.694 Botswana
11 Haryana 0.691 Venezuela
12 Maharashtra 0.688 Iraq
13 Mizoram
14 Tamil Nadu 0.686
15 Manipur 0.678 El Salvador
16 Uttarakhand 0.672
17 Nagaland 0.670 Nicaragua
18 Karnataka 0.667
19 Arunachal Pradesh 0.665 Bhutan
20 Daman and Diu 0.661 Bangladesh
21 Telangana 0.647 Tuvalu
22 Meghalaya 0.643
23 Rajasthan 0.638 Marshall Islands
24 Gujarat 0.638
Flag of India.svg  India (average)0.633 Ghana
25 Andhra Pradesh 0.630
26 Tripura 0.629 Micronesia
27 West Bengal 0.624 Kiribati
28 Dadra and Nagar Haveli 0.620 Honduras
29 Chhattisgarh 0.605 Laos
30 Assam 0.597 Eswatini
31 Odisha
32 Madhya Pradesh 0.596 Equatorial Guinea
33 Uttar Pradesh 0.592 Republic of the Congo
34 Jharkhand 0.589 Zimbabwe
35 Bihar 0.571 Republic of the Congo

HDI (NSC method)

The following values are estimates from 2017 to 2018 calculated by the National Statistical Commission (NSC) of India. [11] These values were calculated based on a modified version of the UNDP method of calculation, using per-capita Gross State Domestic Product (GSDP) in the national currency to measure the "decent standard of living" component of HDI, rather than per-capita Gross National Income (GNI) in Purchasing Power Parity (PPP) US dollars. [12] [13]

RankState/Union TerritoryHDI (2017–2018)
Very High Human Development
1 Delhi 0.839
2 Chandigarh 0.827
3 Goa 0.806
High Human Development
4 Kerala 0.775
5 Sikkim 0.764
6 Himachal Pradesh 0.761
7 Uttarakhand 0.758
8 Puducherry 0.752
9 Maharashtra 0.750
10 Mizoram 0.747
11 Tamil Nadu 0.738
12 Punjab 0.738
13 Haryana 0.724
14 Andaman and Nicobar Islands 0.707
15 Karnataka 0.706
16 Telangana 0.705
17 Meghalaya 0.704
Medium Human Development
18 Gujarat 0.698
19 Daman and Diu 0.695
20 Lakshadweep 0.687
21 Manipur 0.686
22 Arunachal Pradesh 0.684
23 Nagaland 0.678
24 West Bengal 0.674
Flag of India.svg  India (average)0.672
25 Tripura 0.667
26 Jammu and Kashmir 0.663
27 Dadra and Nagar Haveli 0.662
28 Assam 0.651
29 Odisha 0.649
30 Andhra Pradesh 0.648
31 Rajasthan 0.638
32 Chhattisgarh 0.629
33 Jharkhand 0.618
34 Madhya Pradesh 0.616
35 Uttar Pradesh 0.592
36 Bihar 0.551

Human Development Index (by UN Method) of Indian states since 1990 (2019 revision). [14]

StateHDI
1990199520002005201020152019
Northern India
Chandigarh 0.6350.6350.6300.6580.6430.7370.759
New Delhi 0.5800.6150.6570.6850.7020.7340.744
Haryana 0.4710.5010.5430.5870.6280.6890.704
Himachal Pradesh 0.4840.5260.5840.6410.6610.7070.717
Jammu and Kashmir 0.4980.5080.5230.5830.6360.6770.712
Madhya Pradesh 0.4070.4270.4530.4950.5310.5850.607
Punjab 0.5010.5330.5730.690.6510.7060.707
Uttar Pradesh 0.3980.4230.4560.4980.5280.5770.603
Uttarakhand 0.6270.6260.6210.6500.6340.6660.684
Western India
Dadra and Nagar Haveli 0.6720.6730.6730.7020.6880.6650.631
Daman and Diu 0.6510.6520.6550.6820.6690.6930.674
Goa 0.5570.5780.6090.6680.7310.7580.765
Gujarat 0.4740.4930.5210.5690.5990.6540.650
Maharashtra 0.4980.5210.5520.5980.6380.6830.701
Rajasthan 0.4060.4310.4630.5050.5420.6060.650
Eastern India
Andaman and Nicobar Islands 0.6850.6850.6860.7140.7000.7260.719
West Bengal 0.4430.4680.5000.5340.5670.6220.636
Bihar 0.3790.4020.4300.4650.5080.5580.581
Chhattisgarh 0.5620.5590.5550.5810.5660.5950.617
Jharkhand 0.5620.5600.5550.5820.5670.5850.600
Odisha 0.4020.4240.4520.4890.5290.5860.608
Northeastern India
Assam 0.4120.4420.4820.5260.5600.5990.609
Arunachal Pradesh 0.4420.4670.4970.5300.6350.6640.677
Manipur 0.4990.5220.5530.5930.6740.6980.691
Meghalaya 0.4610.4650.4710.5280.6130.6510.654
Mizoram 0.5310.5440.5640.6260.6790.7000.701
Nagaland 0.5390.5310.5180.5530.6540.6820.683
Sikkim 0.5460.5430.5430.5870.6280.6950.715
Tripura 0.4490.4830.5250.5570.6020.6460.640
Southern India
Andhra Pradesh 0.4270.4460.4730.5260.5740.6310.642
Karnataka 0.4470.4740.5120.5610.5990.6620.679
Kerala 0.5500.5650.5930.6750.7090.7630.766
Lakshadweep 0.6940.6940.6950.7240.7100.7350.728
Puducherry 0.7110.7200.7200.7500.7360.7340.739
Tamil Nadu 0.4750.5000.5370.5960.6410.6930.699
Telangana 0.6240.6210.6180.6460.6310.6540.658
India0.4340.4580.4910.5340.5750.6290.645

Compared with the previous Indian National Human Development Reports and the latest state-level government statistical report, India has significantly improved its HDI in all of its administrative subdivisions:

Legend

Very High/High Human Development Index

  0.850–0.899
  0.800–0.849
  0.750–0.799
  0.700–0.749

Medium human development index

  0.650–0.699
  0.600–0.649
  0.550–0.599
  0.500–0.549

Low human development index

  0.450–0.499
  0.400–0.449
  0.350–0.399
  0.300–0.349
  0.250–0.299
  ≤0.250
  Lack of information
Human Development Index map for Indian states in 2006, as calculated by Government of India and UNDP India. 2006 Human Development Index for India map by states, HDI data by GoI and UNDP India.svg
Human Development Index map for Indian states in 2006, as calculated by Government of India and UNDP India.

This is a list of Indian states by their respective Human Development Index (HDI), as of 2008. [1] Kerala stands first in Human Development Index among the states in India.

Consumption-based HDI

There are many ways to calculate HDI, and its calculation is sensitive to base data and assumptions. Using another approach, UNDP India and Government of India calculated the HDI nationwide average to be 0.605 in 2006. [16] This data was published by the Indian Government. [1] Note that the 2007-2008 HDI values in the table below is not based on income as is the UNDP standard practice for global comparisons, but on estimated consumption expenditure – an assumption which underestimates the HDI compared to the actual value. [17] Further, data was unavailable for the following union territories: Chandigarh, Lakshadweep, Andaman and Nicobar Islands, Daman and Diu, Puducherry, and Dadra and Nagar Haveli. [18] [19]

Consumption-based HDI [20] (2007–08) Indian states only
RankState/Union TerritoryHDI
1 Kerala 0.810
2 Delhi 0.750
3 Himachal Pradesh 0.652
4 Goa 0.617
5 Punjab 0.605
6 Northeast India 0.573
7 Maharashtra 0.572
8 Tamil Nadu 0.570
9 Haryana 0.552
10 Jammu and Kashmir 0.542
11 Gujarat 0.527
12 Karnataka 0.519
National average0.513
13 West Bengal 0.492
14 Uttarakhand 0.490
15 Andhra Pradesh 0.473
17 Rajasthan 0.434
18 Uttar Pradesh 0.380
19 Jharkhand 0.376
20 Madhya Pradesh 0.375
21 Bihar 0.367
22 Odisha 0.362
23 Chhattisgarh 0.358

Demographics

Custom set of indicators (2021) [21]
Subnational HDIHealth indexEducational indexIncome indexLife expectancyLife expectancy femalesLife expectancy malesExpected years schoolingExpected years schooling girlsExpected years schooling boysMean years schoolingMean years schooling femalesMean years schooling malesLog Gross National Income per capitaLog Gross National Income per capita femalesLog Gross National Income per capita males
Total0.6330.7270.5520.63367.2468.8965.7611.8811.9411.816.6556.2527.2298.7937.7319.272
Andaman and Nicobar Islands 0.7060.8200.6070.70673.3176.2271.5012.3812.7811.987.9008.4247.7129.2788.1579.783
Andhra Pradesh 0.6300.7340.5170.66067.6969.4466.1911.9512.0411.875.5465.1356.1208.9737.8889.461
Arunachal Pradesh 0.6650.7670.5750.66569.8772.0868.2713.2013.3213.116.2576.1186.5569.0107.9219.500
Assam 0.5970.7140.5300.56466.3867.8364.9211.3511.7011.046.4466.6166.4998.3367.3298.790
Bihar 0.5710.7120.4800.54466.3067.7364.8411.4811.3611.734.8453.7756.0268.2047.2128.650
Chandigarh 0.7440.7800.7040.75170.7173.1169.0712.9513.1912.7710.3211.169.9579.5758.41810.10
Chhattisgarh 0.6050.6890.5280.60964.7665.8363.3311.8512.3011.425.9755.2936.7278.6357.5929.105
Dadra and Nagar Haveli 0.6200.7660.5070.61369.7671.9568.1710.3910.949.9746.5505.6207.2298.6657.6189.137
Daman and Diu 0.6610.7720.5540.67570.2172.4968.5910.6011.0510.217.7857.5388.1009.0707.9749.564
Goa 0.7510.8090.6960.75272.5975.3670.8313.4813.6713.299.64810.439.3989.5858.42710.11
Gujarat 0.6380.7450.5190.66968.4470.3566.9110.6210.3710.786.7286.2397.3249.0377.9459.529
Haryana 0.6910.7560.6130.71369.1271.1867.5712.9013.1212.657.6397.1268.2619.3248.1989.832
Himachal Pradesh 0.7030.7570.6490.70969.1971.2667.6313.2813.8412.718.4038.4738.7169.2998.1759.804
Jammu and Kashmir 0.6990.7620.6440.69669.5671.7167.9814.2414.4314.047.4506.9078.0349.2148.1009.715
Jharkhand 0.5890.7150.5120.55766.4967.9765.0311.7711.9111.695.5564.6136.5858.2957.2938.747
Karnataka 0.6670.7770.5670.67370.5072.8468.8712.1612.3411.976.8966.6767.3339.0577.9639.550
Kerala 0.7520.8340.7130.71674.2377.3272.3514.2014.7713.659.54310.888.8209.3448.2159.852
Lakshadweep 0.7150.7850.6490.71871.0173.4669.3512.8313.3512.398.7799.4088.7269.3568.2259.865
Madhya Pradesh 0.5960.6930.5090.60065.0566.1963.6211.3111.2411.355.8395.0626.6038.5777.5419.044
Maharashtra 0.6880.7790.6200.67670.6072.9768.9712.7512.7112.737.9637.7938.3569.0777.9809.571
Manipur 0.6780.7830.6560.60670.8773.2969.2113.1513.1913.138.7278.8988.9538.6197.5789.088
Meghalaya 0.6430.7530.5720.61668.9370.9467.3812.6713.3811.986.6137.4296.1968.6847.6359.157
Mizoram 0.6880.7250.6360.70567.1568.7765.6612.6412.7112.518.5499.3478.2059.2718.1509.775
Nagaland 0.6700.7670.6140.63969.8472.0568.2512.7013.1412.277.8388.3527.6658.8357.7679.315
New Delhi 0.7300.7750.6840.73370.3572.6668.7313.3013.8412.809.4289.7119.4369.4608.3179.975
Orissa 0.5970.7170.5050.58766.6268.1365.1611.0711.0911.095.9125.5356.4618.4927.4668.954
Puducherry 0.7260.7940.6640.72471.6074.1769.9012.9913.6912.339.1049.4209.3139.3998.2639.910
Punjab 0.6940.7650.5980.72969.7371.9268.1412.3412.9411.797.6708.1577.5229.4328.2929.945
Rajasthan 0.6380.7250.5430.66067.1368.7565.6512.6212.4912.785.7664.4677.0118.9737.8899.461
Sikkim 0.7020.7850.6440.68371.0473.5069.3813.8914.3713.397.7548.3527.5049.1288.0259.625
Tamil Nadu 0.6860.7910.6080.67171.4073.9369.7112.6813.1412.237.6917.9157.8549.0477.9549.539
Telangana 0.6470.7480.5420.66768.5970.5367.0612.4712.6512.305.8705.2086.6989.0227.9329.513
Tripura 0.6290.7730.5490.58670.2572.5468.6311.8411.6912.086.6036.7016.7468.4867.4618.948
Uttar Pradesh 0.5920.6670.5240.59163.3964.1261.9611.2211.1111.346.3835.5357.3148.5197.4908.983
Uttarakhand 0.6720.7330.6090.67867.6669.4066.1612.5012.8512.167.8697.4788.4989.0937.9949.588
West Bengal 0.6240.7610.5340.59869.4871.6167.9011.7712.2711.306.2266.1796.4808.5677.5329.033

Related Research Articles

<span class="mw-page-title-main">Developed country</span> Country with a developed economy and infrastructure

A developed country, or advanced country, is a sovereign state that has a high quality of life, developed economy, and advanced technological infrastructure relative to other less industrialized nations. Most commonly, the criteria for evaluating the degree of economic development are the gross domestic product (GDP), gross national product (GNP), the per capita income, level of industrialization, amount of widespread infrastructure and general standard of living. Which criteria are to be used and which countries can be classified as being developed are subjects of debate. Different definitions of developed countries are provided by the International Monetary Fund and the World Bank; moreover, HDI ranking is used to reflect the composite index of life expectancy, education, and income per capita. Another commonly used measure of a developed country is the threshold of GDP (PPP) per capita of at least US$22,000. In 2023, 40 countries fit all four criteria, while an additional 15 countries fit three out of four.

<span class="mw-page-title-main">Human Development Index</span> Composite statistic of life expectancy, education, and income indices

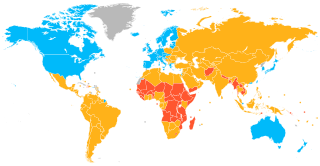
The Human Development Index (HDI) is a statistical composite index of life expectancy, education, and per capita income indicators, which is used to rank countries into four tiers of human development. A country scores a higher level of HDI when the lifespan is higher, the education level is higher, and the gross national income GNI (PPP) per capita is higher. It was developed by Pakistani economist Mahbub ul-Haq and was further used to measure a country's development by the United Nations Development Programme (UNDP)'s Human Development Report Office.

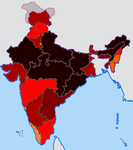
The Human Poverty Index (HPI) was an indication of the poverty of community in a country, developed by the United Nations to complement the Human Development Index (HDI) and was first reported as part of the Human Development Report in 1997. It is developed by United Nations Development Program which also publishes indexes like HDI It was considered to better reflect the extent of deprivation in deprived countries compared to the HDI. In 2010, it was supplanted by the UN's Multidimensional Poverty Index.

<span class="mw-page-title-main">Human Development Report</span> Annual report by the Human Development Report Office of the United Nations Development Programme

The Human Development Report (HDR) is an annual Human Development Index report published by the Human Development Report Office of the United Nations Development Programme (UNDP).

The Gender Development Index (GDI) is an index designed to measure gender equality.

The Gender Empowerment Measure (GEM) is an index designed to measure gender equality. GEM is the United Nations Development Programme's attempt to measure the extent of gender inequality across the globe's countries, based on estimates of women's relative economic income, participation in high-paying positions with economic power, and access to professional and parliamentary positions. It was introduced at the same time as the Gender-related Development Index (GDI) but measures topics like empowerment that are not covered by that index. Since it was first adopted, the GEM has been employed in several academic studies related to empowerment as a reliable metric for comparing gender empowerment across different countries. It has also faced some harsh criticisms, and many alterations and alternatives have been proposed.

<span class="mw-page-title-main">Education Index</span> Component of the Human Development Index

An Education index is a component of the Human Development Index published every year by the United Nations Development Programme. Alongside the Economical indicators and Life Expectancy Index, it helps measure the educational attainment. GNI (PPP) per capita and life expectancy are also used with the education index to get the HDI of each country.

<span class="mw-page-title-main">Multidimensional Poverty Index</span> Range of poverty indicators

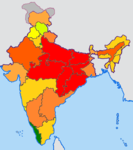
Multidimensional Poverty Indices use a range of indicators to calculate a summary poverty figure for a given population, in which a larger figure indicates a higher level of poverty. This figure considers both the proportion of the population that is deemed poor, and the 'breadth' of poverty experienced by these 'poor' households, following the Alkire & Foster 'counting method'. The method was developed following increased criticism of monetary and consumption based poverty measures, seeking to capture the deprivations in non-monetary factors that contribute towards well-being. While there is a standard set of indicators, dimensions, cutoffs and thresholds used for a 'Global MPI', the method is flexible and there are many examples of poverty studies that modify it to best suit their environment. The methodology has been mainly, but not exclusively, applied to developing countries.

<span class="mw-page-title-main">Gender Inequality Index</span> United Nations index for gender inequality

The Gender Inequality Index (GII) is an index for the measurement of gender disparity that was introduced in the 2010 Human Development Report 20th anniversary edition by the United Nations Development Programme (UNDP). According to the UNDP, this index is a composite measure to quantify the loss of achievement within a country due to gender inequality. It uses three dimensions to measure opportunity cost: reproductive health, empowerment, and labor market participation. The new index was introduced as an experimental measure to remedy the shortcomings of the previous indicators, the Gender Development Index (GDI) and the Gender Empowerment Measure (GEM), both of which were introduced in the 1995 Human Development Report.

References

  1. 1 2 3 "India Human Development Report 2011 (Towards Social Inclusion)" (PDF). IAMR, Planning Commission, Government of India. p. 257. Archived from the original (PDF) on 5 March 2016. Retrieved 5 April 2014.
  2. "Selected Socio-Economic Statistics India, 2011" (PDF). Ministry of Statistics and Programme Implementation, Government of India. October 2011. Table 11.1, page 165. Archived from the original (PDF) on 3 March 2016. Retrieved 24 January 2015.
  3. "India Human Development Report 2011 (Towards Social Inclusion)" (PDF). IAMR, Planning Commission, Government of India. p. 17. Archived from the original (PDF) on 5 March 2016. Retrieved 2 July 2014.
  4. Human Development Report 2013 UNDP, page 64, Tabel 3.1
  5. "Human Development Report 2014 – Sustaining Human Progress: Reducing Vulnerabilities and Building Resilience". United Nations Development Programme. January 2014. Retrieved 24 January 2016.
  6. "India slips in human development index". The Hindu. 21 March 2017. Retrieved 14 September 2017.
  7. "Sub-national HDI – Area Database – Global Data Lab". hdi.globaldatalab.org. Retrieved 24 October 2018.
  8. "| Human Development Reports". hdr.undp.org. January 2018. Retrieved 16 February 2019.
  9. "Human Development" . Retrieved 4 February 2023.
  10. "Construction of the SHDI and SGDI Indices" . Retrieved 27 January 2023.
  11. "Gendering Human Development" . Retrieved 27 January 2023.
  12. "Human development index" . Retrieved 27 January 2023.
  13. "Gendering Human Development" . Retrieved 27 January 2023.
  14. "Human Development Indices (5.0)" . Retrieved 4 February 2023.
  15. "Gendering Human Development Indices" (PDF). Ministry of Women and Child Development, Government of India with UNDP India. March 2009.
  16. Gendering Human Development Indices Archived 1 December 2014 at the Wayback Machine , Ministry of Women and Child Development, Govt of India with UNDP India (2009)
  17. "India Human Development Report 2011 (Towards Social Inclusion)" (PDF). IAMR, Planning Commission, Government of India. p. 24. Archived from the original (PDF) on 5 March 2016. Retrieved 2 July 2014.
  18. "Meghalaya Human Development Report 2008" (PDF). p. 23.
  19. "General Reports: Planning Commission, Government of India". planningcommission.nic.in. Archived from the original on 4 March 2016. Retrieved 24 January 2016.
  20. "India Human Development Report 2011 (Towards Social Inclusion) – Summary" (PDF). IAMR, Planning Commission, Government of India. p. 2. Retrieved 27 October 2014.
  21. "Custom set of indicators (2021) – Subnational HDI – Table – Global Data Lab". globaldatalab.org. Retrieved 7 April 2023.