
The Central Bureau of Investigation (CBI) is the domestic crime investigating agency of India. It operates under the jurisdiction of the Ministry of Personnel, Public Grievances and Pensions. Originally set up to investigate bribery and governmental corruption, in 1965 it received expanded jurisdiction to investigate breaches of central laws enforceable by the Government of India, multi-state organised crime, multi-agency or international cases. The agency has been known to investigate several economic crimes, special crimes, cases of corruption and other cases. CBI is exempted from the provisions of the Right to Information Act. CBI is India's officially designated single point of contact for liaison with the Interpol.

Crime in Canada is generally considered low overall. Under the Canadian constitution, the power to establish criminal law and rules of investigation is vested in the federal Parliament. The provinces share responsibility for law enforcement, and while the power to prosecute criminal offences is assigned to the federal government, responsibility for prosecutions is delegated to the provinces for most types of criminal offences. Laws and sentencing guidelines are uniform throughout the country, but provinces vary in their level of enforcement.
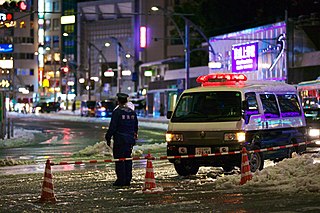
Law enforcement in Japan is provided mainly by prefectural police under the oversight of the National Police Agency. The National Police Agency is administered by the National Public Safety Commission, ensuring that Japan's police are an apolitical body and free of direct central government executive control. They are checked by an independent judiciary and monitored by a free and active press.

Dainik Bhaskar is a Hindi-language daily newspaper in India which is owned by the Dainik Bhaskar Group. According to the World Association of Newspapers, it ranked fourth in the world by circulation in 2016 and per the Indian Audit Bureau of Circulations was the eleventh largest newspaper in India by circulation as of 2022. Started in Bhopal in 1958, it expanded in 1983 with the launch of Dainik Bhaskar's Indore edition. The Dainik Bhaskar Group is present in 13 Indian states with 65 editions in Hindi, Marathi, and Gujarati.
Statistics on rape and other acts of sexual assault are commonly available in industrialized countries, and have become better documented throughout the world. Inconsistent definitions of rape, different rates of reporting, recording, prosecution and conviction for rape can create controversial statistical disparities, and lead to accusations that many rape statistics are unreliable or misleading.
Farmers' suicides in India refers to the event of farmers dying by suicide in India since the 1970s, due to their inability to repay loans mostly taken from private landlords and banks. India being an agrarian country with around 70% of its rural population depending directly or indirectly upon agriculture, the sector had a 15% share in the economy of India in 2023, and according to NSSO, around 45.5% of country's labor force was associated with agriculture in 2022. Activists and scholars have offered several conflicting reasons for farmer suicides, such as anti-farmer laws, high debt burdens, poor government policies, corruption in subsidies, crop failure, mental health, personal issues and family problems.
Crime has been recorded in the United States since its founding and has fluctuated significantly over time. Most available data underestimate crime before the 1930s, giving the false impression that crime was low in the early 1900s and had a sharp rise after. Instead, violent crime during the colonial period was likely three times higher than the highest modern rates in the data we have, and crime had been on the decline since colonial times. Within the better data for crime reporting and recording available starting in the 1930s, crime reached its broad, bulging modern peak between the 1970s and early 1990s. After 1992, crime rates have generally trended downwards each year, with the exceptions of a slight increase in property crimes in 2001 and increases in violent crimes in 2005–2006, 2014–2016 and 2020–2021.
The Scheduled Castes and the Scheduled Tribes Act, 1989 was enacted by the Parliament of India to prevent atrocities and hate crimes against the scheduled castes and scheduled tribes. In popular usage, including in parliamentary debates and in the judgements of the Supreme Court of India, it is referred to as the SC/ST Act. It is also referred to as the 'Atrocities Act', POA, and PoA.
Crime in India has been recorded since the British Raj, with comprehensive statistics now compiled annually by the National Crime Records Bureau (NCRB), under the Ministry of Home Affairs (India).

According to the World Prison Brief the United States in 2021 had the sixth highest incarceration rate in the world, at 531 people per 100,000. Between 2019 and 2020, the United States saw a significant drop in the total number of incarcerations. State and federal prison and local jail incarcerations dropped by 14% from 2.1 million in 2019 to 1.8 million in mid-2020. In 2018, the United States had the highest incarceration rate in the world.

The National Investigation Agency (NIA) is a specialised counter-terrorism law enforcement agency in India. The agency is empowered to deal with the investigation of terror related crimes across states without special permission from the states under written proclamation from the Ministry of Home Affairs. The primary mandate of the National Investigation Agency is to investigate and prosecute offences that have national and cross-border implications, specifically focusing on terrorism, insurgency, and other related matters. It is empowered to investigate cases that involve threats to the sovereignty, security, and integrity of India. It has the authority to conduct searches, make seizures and arrests, as well as to collect evidence and maintain a database of terrorist organisations and their members.

The Enforcement Directorate (ED) is a law enforcement and economic intelligence agency of the Government of India. Established on May 1, 1956, it is responsible for enforcing economic laws and combating financial crimes. The ED operates under the Department of Revenue, Ministry of Finance, with its headquarters in New Delhi.
The conviction rate, expressed as a percentage, represents the proportion of cases resulting in a legal declaration of guilt for an offense, against the total number of trials completed. It is calculated by dividing the number of convictions by the total number of adjudicated cases and then multiplying by 100. A conviction is a legal declaration that someone is guilty of committing an offense, determined through a jury's or bench's verdict within a court of law.

Domestic violence in India includes any form of violence suffered by a person from a biological relative but typically is the violence suffered by a woman by male members of her family or relatives. Although Men also suffer Domestic violence, the law under IPC 498A specifically protects only women. Specifically only a woman can file a case of domestic violence. According to a National Family and Health Survey in 2005, total lifetime prevalence of domestic violence was 33.5% and 8.5% for sexual violence among women aged 15–49. A 2014 study in The Lancet reports that although the reported sexual violence rate in India is among the lowest in the world, the large population of India means that the violence affects 27.5 million women over their lifetimes. However, an opinion survey among experts carried out by the Thomson Reuters Foundation ranked India as the most dangerous country in the world for women.
Rape is the fourth most common crime against women in India. According to the 2021 annual report of the National Crime Records Bureau (NCRB), 31,677 rape cases were registered across the country, or an average of 86 cases daily, a rise from 2020 with 28,046 cases, while in 2019, 32,033 cases were registered. Of the total 31,677 rape cases, 28,147 of the rapes were committed by persons known to the victim. The share of victims who were minors or below 18 – the legal age of consent – stood at 10%.
Prisons in India are overcrowded and eight of out ten prisoners in Indian jails await trial. There are 1319 prisons in India as of 2021. Currently, there are about 1400 prisons. After the COVID-19 pandemic, the number of prisoners increased 13% from 2020 to 2021, making over 80% of the prisons overcrowded. After the Supreme Court order, a number of prisoners were released in 2020 to decongest the jails, reducing the overall prison occupancy in 20 states and two Union Territories to a little over 93%. However, the occupancy rate increased to 130% again by 2021. About 63 unnatural deaths took place in Indian prisons. Among the major states, Tamil Nadu is the only state which has less than 100% occupancy followed by Karnataka.
Rape in Sweden has a legal definition described in Chapter 6 in the Swedish Penal Code. Historically, rape has been defined as forced sexual intercourse initiated against a woman or man by one or several people, without consent. In recent years, several revisions to the definition of rape have been made to the law of Sweden, to include not only intercourse but also comparable sexual acts against someone incapable of giving consent, due to being in a vulnerable situation, such as a state of fear or unconsciousness.
This is a list of states and union territories of India ranked according to crime against women and rate of crime against women. The list is compiled from the 2016 and 2018 Crime in India Report published by National Crime Records Bureau (NCRB), Government of India.
