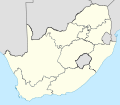
List of South African provinces by Human Development Index

Last updated

Map of the South African provinces by Human Development Index in 2017.
Legend:
.mw-parser-output .legend{page-break-inside:avoid;break-inside:avoid-column}.mw-parser-output .legend-color{display:inline-block;min-width:1.25em;height:1.25em;line-height:1.25;margin:1px 0;text-align:center;border:1px solid black;background-color:transparent;color:black}.mw-parser-output .legend-text{}
0.700 - 0.799 (high)
0.600 - 0.699 (medium) South African provinces by HDI (2017).svg
Map of the South African provinces by Human Development Index in 2017.
Legend:
  0.700 – 0.799 (high)
  0.600 – 0.699 (medium)

This is a list of the provinces of South Africa by Human Development Index as of 2022. [1]

RankProvinceHDI (2022)
High human development
1 Western Cape 0.755
2 Gauteng 0.739
3 Limpopo 0.718
Flag of South Africa.svg  South Africa (average)Decrease2.svg 0.717
4 Free State 0.716
5 KwaZulu-Natal 0.714
6 Northern Cape 0.705
Medium human development
7 Mpumalanga 0.682
8 North West 0.680
9 Eastern Cape 0.678

Historical data [2]

Province1990199520002005201020152020
Western Cape0.7110.7450.7050.6890.7170.7530.766
Gauteng0.6960.7290.6920.6810.7140.7410.750
Free State0.6480.6770.6460.6370.6720.7140.726
Limpopo0.5980.6230.6040.6120.6630.7150.727
KwaZulu-Natal0.5890.6150.5940.6040.6560.7100.724
Northern Cape0.6250.6540.6240.6180.6550.7020.715
Mpumalanga0.6090.6350.6100.6080.6490.6830.692
North West0.6260.6540.6240.6150.6480.6810.690
Eastern Cape0.5810.6060.5830.5860.6310.6770.688
South Africa0.6320.6610.6330.6320.6750.7160.727

References

  1. "Sub-national HDI - Area Database - Global Data Lab". hdi.globaldatalab.org.
  2. "Sub-national HDI - Area Database - Global Data Lab". hdi.globaldatalab.org.