Map of Latin America showing modern political divisions
Latin America as a region has multiple nation-states, with varying levels of economic complexity. The Latin American economy is an export-based economy consisting of individual countries in the geographical regions of North America, Central America, South America, and the Caribbean. The socioeconomic patterns of what is now called Latin America were set in the colonial era when the region was controlled by the Spanish and Portuguese empires. Up until independence in the early nineteenth century, colonial Latin American regional economies thrived and worked things out. Many parts of the region had favorable factor endowments of deposits of precious metals, mainly silver, or tropical climatic conditions and locations near coasts that allowed for the development of cane sugar plantations. In the nineteenth century following independence, many economies of Latin America declined.[1][2] In the late nineteenth century, much of Latin America was integrated into the world economy as an exporter of commodities. Foreign capital investment, construction of infrastructure, such as railroads, growth in the labor sector with immigration from abroad, strengthening of institutions, and expansion of education aided industrial growth and economic expansion.[3] A number of regions have thriving economies, but "poverty and inequality have been deeply rooted in Latin American societies since the early colonial era."[4]
As of 2021, the population of Latin America is 656 million people[5] and the total gross domestic product of Latin America in 2019 was US$5.1trillion. The main exports from Latin America are agricultural products and natural resources such as copper, iron, and petroleum. In 2016, the Latin American economy contracted 0.8% after a stagnant 2015.[6]Morgan Stanley suggests that this drop in economic activity is a combination of low commodity prices, capital flight, and volatility in local currency markets.[7]The International Monetary Fund suggests that external conditions influencing Latin America have worsened in the period from 2010 to 2016, but will show growth in 2017.[8]
Historically, Latin America has been an export-based, with silver and sugar being the motors of the colonial economy. The region remains a major source of raw materials and minerals.[9] Over time, Latin American countries have focused on efforts to integrate their products into global markets.[9] Latin America's economy is composed of two main economic sectors: agriculture and mining. Latin America has large areas of land that are rich in minerals and other raw materials.[9] Also, the tropical and temperate climates of Latin America makes it ideal for growing a variety of agricultural products.[9]
Infrastructure in Latin America has been classified as sub-par compared to economies with similar income levels.[10] There is room to grow and some countries have already taken the initiative to form partnerships with the private sector to increase infrastructure spending.[11] The main economies of Latin America are Brazil, Argentina, Colombia, Mexico, and Chile. These economies have been given positive outlooks for 2017 by Morgan Stanley.[7] The Latin American economy is largely based on commodity exports, therefore, the global price of commodities has a significant effect on the growth of Latin American economies. Because of its strong growth potential and wealth of natural resources, Latin America has attracted foreign investment from the United States and Europe.
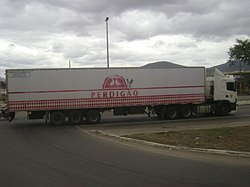
Sugarcane plantation in São Paulo. In 2018, Brazil was the world's largest producer, with 746 million tons. Latin America produces more than half of the world's sugarcane.Soy plantation in Mato Grosso. In 2020, Brazil was the world's largest producer, with 130 million tons. Latin America produces half of the world's soybeans.Coffee in Minas Gerais. In 2018, Brazil was the world's largest producer, with 3.5million tons. Latin America produces half of the world's coffee.Orange in São Paulo. In 2018, Brazil was the world's largest producer, with 17 million tons. Latin America produces 30% of the world's orange.Truck of a meat company in Brazil. Latin America produces 25% of the world's beef and chicken meat.
Agriculture is a sector of most Latin American economies, but in general those countries depending on agriculture as a major component of GDP are less developed than those with a robust industrial sector. There is an unequal distribution of landholders, dating to the colonial era. In many countries a disproportionate number of small cultivators who are not entirely self-sufficient, subsistence farmers, but are not part of the export economy.[12] Agricultural productivity itself could be another reason for inequality in a given region. That is to say, agricultural incomes could lag behind industrial and service sector incomes leading to higher inequality.[13] Latin America produces and exports a diverse range of agricultural products such as coffee, cacao, bananas, soya, and beef, but most countries only produce one or two such exports.[14][15] Latin America accounts for 16% of the world's food and agriculture production. Brazil and Argentina lead the region in terms of net export due to high grain, oilseed, and animal protein exports.[14] The structure of the agriculture sector is very diverse. In Brazil and Argentina large farms account for most of the commercial agriculture, but in much of Latin America, agriculture production comes from the region's small farms.
Global demand for agricultural products is rising due to the world's growing population and income levels. By 2050, the world's population is expected to reach 9billion people and the demand for food is forecast to be 60% higher than it was in 2014.[14] Distribution of unexploited land in Latin America is very uneven, with Brazil and Argentina having the most access to additional land.[14]
Rabobank reports that Latin American has achieved rates of agricultural productivity that are above the global average, however, there is a lot of variation in the performance of the individual countries.[14] For large commercial farms, investment in precision agriculture and plant breeding techniques will lead to an increase in productivity, and for small-scale farms, access to basic technology and information services will lead to an increase in productivity.[14]
Chile is one of the 5 largest world producers of cherry and cranberry, and one of the 10 largest world producers of grape, apple, kiwi, peach, plum and hazelnut, focusing on exporting high-value fruits;
Paraguay's agriculture is currently developing, being currently the 6th largest producer of soy in the world and entering the list of the 20 largest producers of maize and sugarcane.[16]
Brazil is the world's largest exporter of chicken meat: 3.77million tons in 2019.[17][18] The country is the holder of the second largest herd of cattle in the world, 22.2% of the world herd. The country was the second largest producer of beef in 2019, responsible for 15.4% of global production.[19] It was also the 3rd largest world producer of milk in 2018. This year, the country produced 35.1billion liters.[20] In 2019, Brazil was the 4th largest pork producer in the world, with almost 4 million tons.[21]
In 2018, Argentina was the 4th largest producer of beef in the world, with a production of 3 million tons (behind only USA, Brazil and China). Uruguay is also a major meat producer. In 2018, it produced 589 thousand tons of beef.[22]
In the production of chicken meat, Mexico is among the 10 largest producers in the world, Argentina among the 15 largest and Peru and Colombia among the 20 largest. In the production of beef, Mexico is one of the 10 largest producers in the world and Colombia is one of the 20 largest producers. In the production of pork, Mexico is among the 15 largest producers in the world. In the production of honey, Argentina is among the 5 largest producers in the world, Mexico among the 10 largest and Brazil among the 15 largest. In terms of cow's milk production, Mexico is among the 15 largest producers in the world and Argentina among the 20.[23]
Mining and petroleum
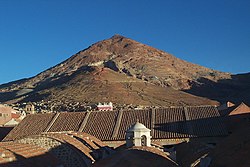
Cerro Rico, Potosi, Bolivia, still a major silver mineIron mine in Minas Gerais. Brazil is the world's second largest iron ore exporter.Amethyst mine in Ametista do Sul. Latin America is a major producer of gems such as amethyst, topaz, emerald, aquamarine and tourmaline
Mining for precious metals dates to the prehispanic period in Latin America and was the economic driver for the throughout the colonial period in Spanish America and in the eighteenth century in Brazil. Extraction of minerals and petroleum dominate certain countries' economies rather than agriculture, especially Venezuela, Mexico, Chile, and Bolivia.[15] In general, mining sites had only a local environmental impact, using relatively low-energy technology such as hand tools, but modern mining technologies use machinery and create open pits mines rather than tunnels, with considerable environmental impact. These enterprises are large scale industrial enterprises requiring considerable capital investment. An exception to this model is gold mining in river systems, especially the Amazon, where poor miners extract gold from auriferous sands, and somewhat larger scale enterprises dredge the sands. Toxic chemicals are used in mine processing, including mercury and arsenic. Discharge of chemical waste into water systems contaminate them. Current mining practices create problems in all stages of production, from extraction to finished product.[24]
Recent mining of lithium in the Northwest of Argentina and Bolivia, as well as the discovery of new deposits are important since lithium is a key component in batteries to power electronics, such as mobile phones, electric cars, and electricity grids. Argentina's resources are now being mined by a joint Australian-Japanese-Argentina venture. Chile has been a major producer for decades, from the Atacama salt flat.[25]
Latin America produces 45% of the world's copper, 50% of the world's silver, 26% of the world's molybdenum, and 21% of the world's zinc.[26]
Half of the participants in a BNAmerica's mining survey believe that political and legal uncertainty will slow mining investment in Latin America in 2017.[27] However, individual countries have implemented changes that could improve conditions for mining companies in 2017. Costs related to labor, energy, and supplies have increased for Latin American mining companies.[27] Thus, many companies are focused on reducing costs and improving efficiency to achieve growth. Some companies are looking towards consolidation, automation, and owner-operated mines to lessen the impacts of rising costs.[27]
In the mining sector, Brazil stands out in the extraction of iron ore (where it is the second world exporter), copper, gold, bauxite (one of the 5 largest producers in the world), manganese (one of the 5 largest producers in the world), tin (one of the largest producers in the world), niobium (concentrates 98% of reserves known to the world) and nickel. In terms of precious stones, Brazil is the world's largest producer of amethyst, topaz, agate and one of the main producers of tourmaline, emerald, aquamarine and garnet.[28][29][30][31][32][33]Chile contributes about a third of the world copper production. In 2018, Peru was the 2nd largest producer of silver and copper in the world, and the 6th largest producer of gold (the 3 metals that generate the highest value), in addition to being the 3rd largest producer in the world of zinc and tin and 4th in lead. Bolivia is the 5th largest producer of tin, the 7th largest producer of silver, and the 8th largest producer of zinc in the world[34][35]Mexico is the largest producer of silver in the world, representing almost 23% of world production, producing more than 200 million ounces in 2019. It also has important copper and zinc and produces a significant amount of gold.[36]
In the production of oil, Brazil was the 10th largest oil producer in the world in 2019, with 2.8million barrels / day. Mexico was the twelfth largest, with 2.1million barrels / day, Colombia in 20th place with 886 thousand barrels / day, Venezuela was the twenty-first place, with 877 thousand barrels / day, Ecuador in 28th with 531 thousand barrels / day and Argentina. 29 with 507 thousand barrels / day. Since Venezuela and Ecuador consume little oil and export most of their production, they are part of OPEC. Venezuela had a big drop in production after 2015 (where it produced 2.5million barrels / day), falling in 2016 to 2.2million, in 2017 to 2 million, in 2018 to 1.4million and in 2019 to 877 thousand, due to lack of investments.[37]
In the production of natural gas, in 2018, Argentina produced 1,524 bcf (billions of cubic feet), Mexico produced 999, Venezuela 946, Brazil 877, Bolivia 617, Peru 451, Colombia 379.[38]
Manufacturing
A maquiladora assembly plant in MexicoBraskem, the largest Brazilian chemical industryEMS, the largest Brazilian pharmaceutical industry
Although a significant proportion of production is in the mining and agricultural sectors, various countries of Latin America have significant manufacturing sectors as well. The economies of Argentina, Brazil, Chile, and Mexico have been the most heavily industrialized countries, accounting for 75% of Latin America's manufacturing sector.[39] In a number of cases, governments followed policies of import substitution industrialization, setting up tariffs against foreign manufactured goods in order to encourage domestic manufacturing industries.[40] Latin America has developed a significant automotive manufacturing, with foreign companies setting up plants in Brazil, Mexico, and elsewhere.[41] In Mexico, for example, the Ford Motor Company set up a plant in 1925, and the automotive industry in Mexico includes most of the major car makers.[42][43] Assembly plants known as maquiladoras or maquilas, where imported components are turned into finished products and then exported have boomed along the U.S.–Mexico border.[44] Brazil's automotive industry played an important role in the country's industrial development.[45] Because of the transportation challenges in Brazil, with coastal cities not easily connected by road or rail, the country took steps to develop an aircraft industry and in 1969, the company Embraer was founded, specializing in regional jets.[46]
The World Bank annually lists the top manufacturing countries by total manufacturing value. According to the 2019 list, Mexico would have the twelfth most valuable industry in the world (US$217.8billion), Brazil has the thirteenth largest (US$173.6billion), Venezuela the thirtieth largest (US$58.2billion, however, which depend on oil to obtain this value), Argentina the 31st largest (US$57.7billion), Colombia the 46th largest (US$35.4billion), Peru the 50th largest (US$28.7billion) and Chile the 51st largest (US$28.3billion).[47]
In Latin America, few countries achieve projection in industrial activity: Brazil, Argentina, Mexico and, less prominently, Chile. Begun late, the industrialization of these countries received a great boost from World War II: this prevented the countries at war from buying the products they were used to importing and exporting what they produced. At that time, benefiting from the abundant local raw material, the low wages paid to the labor force and a certain specialization brought by immigrants, countries such as Brazil, Mexico and Argentina, as well as Venezuela, Chile, Colombia and Peru, were able to implement important industrial parks. In general, in these countries there are industries that require little capital and simple technology for their installation, such as the food processing and textile industries. The basic industries (steel, etc.) also stand out, as well as the metallurgical and mechanical industries.
The industrial parks of Brazil, Mexico, Argentina and Chile, however, present much greater diversity and sophistication, producing advanced technology items. In the rest of Latin American countries, mainly in Central America, the processing industries of primary products for export predominate.
In the food industry, in 2019, Brazil was the second largest exporter of processed foods in the world.[48][49][50] In 2016, the country was the 2nd largest producer of pulp in the world and the 8th producer of paper.[51][52][53] In the footwear industry, in 2019, Brazil ranked 4th among world producers.[54][55][56][57] In 2019, the country was the 8th producer of vehicles and the 9th producer of steel in the world.[58][59][60] In 2018, the chemical industry of Brazil was the 8th in the world.[61][62][63] In textile industry, Brazil, although it was among the 5 largest world producers in 2013, is very little integrated in world trade.[64] In the aviation sector, Brazil has Embraer, the third largest aircraft manufacturer in the world, behind Boeing and Airbus.
Gallery
Grape plantation in Argentina. Argentina and Chile are among the 10 largest grape and wine producers in the world and Brazil among the 20 largest.
Maize in Dourados. Brazil, Argentina and Mexico are among the 10 largest world producers
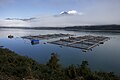
Salmon farming in Chile. One third of all salmon sold in the world comes from the country.
Neugebauer Chocolate Factory in Arroio do Meio. Latin America specializes in food processing
Steel-maker CSN, in Volta Redonda. Brazil is one of the 10 largest steel producers in the world; Mexico is one of the 15 largest and Argentina one of the 30 largest
Klabin industrial complex, in Ortigueira. Brazil is the second largest pulp producer and the eighth largest paper producer in the world
Portico of the Democrata men's shoe factory, in Franca. Brazil is the fourth largest shoe manufacturer in the world.
Hering, in Santa Catarina, Brazil. The country has one of the 5 largest textile industries in the world
Mercedes-Benz plant in São Paulo. Mexico and Brazil are among the 10 largest vehicle manufacturers in the world and Argentina among the 30 largest.
Copper mine in Chile. Latin America produces more than half of the world's copper
Colombian emerald. The country is the largest producer of emeralds in the world, and Brazil is one of the largest producers
Copacabana Palace, the best hotel in South America, in Rio de Janeiro. Tourism brings important currencies to the continent.
Honey production in Argentina. The country is the third largest producer of honey in the world.
Sunflower plantation in Argentina. The country is the world's third largest producer of sunflower seed.
Chilean cherries. Chile is one of the top 5 producers of sweet cherries in the world.
Chilean kiwi. The country is one of the 10 largest kiwi producers in the world.
Palm plantation in Magdalena. Colombia is one of the top 5 palm oil producers in the world.
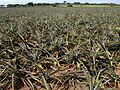
Pineapple in Veracruz, Mexico. Latin America produces 35% of the world's pineapple.
Financial
Latin American countries have had functioning banks and stock exchanges since the nineteenth century. Central banks have been established in most countries of Latin America to issue currency, manage flows, and implement monetary policy. In countries where there was significant commodity export activity and foreign capital presence, stock exchanges were established in the nineteenth century: Rio de Janeiro, Brazil (1845); Buenos Aires, Argentina (1854); Peru (1860); Rosario, Argentina; Mexico (1886); Uruguay (1867). Most other Latin American countries that created stock exchanges did so in the late twentieth century.
In the late twentieth century, narcotrafficking, particularly cocaine in parts of Latin America infused some economies with large amounts of cash. Two Colombian narcotrafficking organizations, the Cali Cartel and the Medellin Cartel, utilized the First InterAmericas Bank to launder large amounts of money in Panama.[65] Data leaks such as the Panama Papers indicate the importance of money laundering in that country, where the Mossack Fonseca ran a global network of money laundry in the main financial centers like London, NYC, Hong Kong, Singapore, man island, Jersey, Monaco, Zürich. 90% of the laundry was made in the developed countries. Panamá by year could clean 3billion dollars, but centers like London at least 63 billions per year.[citation needed]
In Latin America, the level of infrastructure is described as inadequate and is one of the region's main barriers to economic growth and development.[10] The International Monetary Fund reports that there is a positive correlation between infrastructure quality and income levels in Latin American countries, however, countries in Latin America have lower quality infrastructure relative to other countries with similar income levels. This causes a loss of competitiveness due to the quality of physical infrastructure has been a significant drag on economic growth.[10]
Governments play an important role in encouraging infrastructure investment. In Latin America, there are sectoral planning institutions in place across the region, but many key attributes can be improved. The International Monetary Fund found that Latin America performs poorly in the availability of funding for infrastructure and the availability of multiyear budgeting frameworks.
Latin America invests roughly 3% of its GDP into infrastructure projects.[11] The Financial Times suggests that infrastructure spending should be at least 6% for Latin America to reach its infrastructure goals.[11] This can be done by promoting private sector participation. The Private sector also plays an active role in supplying infrastructure. Governments in Latin America do a poor job of encouraging private sector participation.[10] Developing financial markets for infrastructure bonds and other financial products can help governments mobilize resources for infrastructure projects while limiting their exposure to currency risk.
While infrastructure in Latin America still has room to grow, there are encouraging signs for investment in Latin American infrastructure.[66] In 2013, private equity firms invested more than $3.5billion in energy, telecom, and supply chain development. Governments are still looking for small partnerships between the public and private sectors to reduce inadequacies in the trade dynamic. Panama has taken steps in the direction to integrate its physical infrastructure for supply chain capacity. Panama completed the expansion of the Panama Canal to accommodate larger ships that exceeded Panamax size. In 2014, Panama built the new Tocumen International Airport and the Colón Free Trade Zone are major mechanisms to enhance supply chains in Panama.[66]
China has had ambitious infrastructure project plans in Latin America, including a railway line linking the Atlantic and Pacific regions of Colombia, and an even longer one from Brazil to Peru, but plans have not translated to completed projects.[67] A Hong Kong-financed project with the government of Nicaragua has plans to construct the Nicaragua Interoceanic Grand Canal Project through Lake Nicaragua, the largest lake in Central America, to compete with the Panama Canal. The Hong Kong-based HKND group the sole concessionaire.[68]
A major international highway, completed in 2012, has linked Brazil with Peru via the Interoceanic Highway. It has economic benefits, but it also opens up areas of Amazonia to environmental degradation.[69] Brazil has also funded a major upgrade of the Cuba port of Mariel, Cuba to handle large container ships.[70]
Transport in Latin America is basically carried out using the road mode, the most developed in the region. There is also a considerable infrastructure of ports and airports. The railway and fluvial sector, although it has potential, is usually treated in a secondary way.
Brazil has more than 1.7million km of roads, of which 215,000km are paved, and about 14,000km are divided highways. The two most important highways in the country are BR-101 and BR-116.[71] Argentina has more than 600,000km of roads, of which about 70,000km are paved, and about 2,500km are divided highways. The three most important highways in the country are Route 9, Route 7 and Route 14.[71] Colombia has about 210,000km of roads, and about 2,300km are divided highways.[72] Chile has about 82,000km of roads, 20,000km of which are paved, and about 2,000km are divided highways. The most important highway in the country is the Route 5 (Pan-American Highway)[73] These 4 countries are the ones with the best road infrastructure and with the largest number of double-lane highways, in South America.
The roadway network in Mexico has an extent of 366,095km (227,481mi),[74] of which 116,802km (72,577mi) are paved,[75][76] Of these, 10,474km (6,508mi) are multi-lane expressways: 9,544km (5,930mi) are four-lane highways and the rest have 6 or more lanes.[75]
Due to the Andes Mountains, Amazon River and Amazon Forest, there have always been difficulties in implementing transcontinental or bioceanic highways. Practically the only route that existed was the one that connected Brazil to Buenos Aires, in Argentina and later to Santiago, in Chile. However, in recent years, with the combined effort of countries, new routes have started to emerge, such as Brazil-Peru (Interoceanic Highway), and a new highway between Brazil, Paraguay, northern Argentina and northern Chile (Bioceanic Corridor).
Rio de Janeiro International AirportPort of Itajaí, Santa Catarina, Brazil
There are more than 2,000 airports in Brazil. The country has the second largest number of airports in the world, behind only the United States. São Paulo International Airport, located in the Metropolitan Region of São Paulo, is the largest and busiest in the country – the airport connects São Paulo to practically all major cities around the world. Brazil has 44 international airports, such as those in Rio de Janeiro, Brasília, Belo Horizonte, Porto Alegre, Florianópolis, Cuiabá, Salvador, Recife, Fortaleza, Belém and Manaus, among others. Argentina has important international airports such as Buenos Aires, Cordoba, Bariloche, Mendoza, Salta, Puerto Iguazú, Neuquén and Usuhaia, among others. Chile has important international airports such as Santiago, Antofagasta, Puerto Montt, Punta Arenas and Iquique, among others. Colombia has important international airports such as Bogotá, Medellín, Cartagena, Cali and Barranquilla, among others. Peru has important international airports such as Lima, Cuzco and Arequipa. Other important airports are those in the capitals of Uruguay (Montevideo), Paraguay (Asunción), Bolivia (La Paz) and Ecuador (Quito). The 10 busiest airports in South America in 2017 were: São Paulo-Guarulhos (Brazil), Bogotá (Colombia), São Paulo-Congonhas (Brazil), Santiago (Chile), Lima (Peru), Brasília (Brazil), Rio de Janeiro (Brazil), Buenos Aires-Aeroparque (Argentina), Buenos Aires-Ezeiza (Argentina), and Minas Gerais (Brazil).[77]
There are 1,834 airports in Mexico, the third-largest number of airports by country in the world.[78] The seven largest airports—which absorb 90% of air travel—are (in order of air traffic): Mexico City, Cancún, Guadalajara, Monterrey, Tijuana, Acapulco, and Puerto Vallarta.[79] Considering all of Latin America, the 10 busiest airports in 2017 were: Mexico City (Mexico), São Paulo-Guarulhos (Brazil), Bogotá (Colombia), Cancún (Mexico), São Paulo-Congonhas (Brazil), Santiago ( Chile), Lima (Peru), Brasilia (Brazil), Rio de Janeiro (Brazil) and Tocumen (Panama).[77]
The four major seaports concentrating around 60% of the merchandise traffic in Mexico are Altamira and Veracruz in the Gulf of Mexico, and Manzanillo and Lázaro Cárdenas in the Pacific Ocean. Considering all of Latin America, the 10 largest ports in terms of movement are: Colon (Panama), Santos (Brazil), Manzanillo (Mexico), Bahia de Cartagena (Colombia), Pacifico (Panama), Callao (Peru), Guayaquil ( Ecuador), Buenos Aires (Argentina), San Antonio (Chile) and Buenaventura (Colombia).[80]
The Brazilian railway network has an extension of about 30,000 kilometers. It's basically used for transporting ores.[81] The Argentine rail network, with 47,000km of tracks, was one of the largest in the world and continues to be the most extensive in Latin America. It came to have about 100,000km of rails, but the lifting of tracks and the emphasis placed on motor transport gradually reduced it. It has four different trails and international connections with Paraguay, Bolivia, Chile, Brazil and Uruguay. Chile has almost 7,000km of railways, with connections to Argentina, Bolivia and Peru. Colombia has only about 3,500km of railways.[82]
Among the main Brazilian waterways, two stand out: Hidrovia Tietê-Paraná (which has a length of 2,400km, 1,600 on the Paraná River and 800km on the Tietê River, draining agricultural production from the states of Mato Grosso, Mato Grosso do Sul, Goiás and part of Rondônia, Tocantins and Minas General) and Hidrovia do Solimões-Amazonas (it has two sections: Solimões, which extends from Tabatinga to Manaus, with approximately 1600km, and Amazonas, which extends from Manaus to Belém, with 1650km. Almost entirely passenger transport from the Amazon plain is done by this waterway, in addition to practically all cargo transportation that is directed to the major regional centers of Belém and Manaus). In Brazil, this transport is still underutilized: the most important waterway stretches, from an economic point of view, are found in the Southeast and South of the country. Its full use still depends on the construction of locks, major dredging works and, mainly, of ports that allow intermodal integration. In Argentina, the waterway network is made up of the La Plata, Paraná, Paraguay and Uruguay rivers. The main river ports are Zárate and Campana. The port of Buenos Aires is historically the first in individual importance, but the area known as Up-River, which stretches along 67km of the Santa Fé portion of the Paraná River, brings together 17 ports that concentrate 50% of the total exports of the country.
The 2024 World Bank report, "Revitalizing Growth: An Urgent Agenda for Latin America and the Caribbean," highlights critical infrastructure deficiencies that are impeding economic progress and exacerbating inequalities within the region. The findings indicate that significant portions of infrastructure, particularly in transportation, energy, and telecommunications, are inadequate and unevenly distributed, especially affecting rural and marginalized communities. The report provides concrete data showing that only about 65% of roads in the region are paved, which compares unfavorably with higher rates in more developed regions, impacting trade efficiency and economic integration. Additionally, it points out that approximately 30% of the population does not have reliable access to the internet, which poses barriers to digital inclusion and economic opportunities.[83]
The World Bank recommends increasing infrastructure investment to 5% of the region's GDP, a substantial rise from current levels, to address these critical gaps. This investment is seen as essential not only for improving physical infrastructure but also for fostering economic resilience and promoting inclusive growth. Moreover, the report emphasizes the necessity of regulatory reforms and the development of robust public-private partnerships. These partnerships are viewed as vital for mobilizing the capital, innovation, and expertise needed to enhance infrastructure and, by extension, to support sustainable development across Latin America and the Caribbean.[83]
The Brazilian government has undertaken an ambitious program to reduce dependence on imported petroleum. Imports previously accounted for more than 70% of the country's oil needs but Brazil became self-sufficient in oil in 2006–2007. Brazil was the 10th largest oil producer in the world in 2019, with 2.8million barrels / day. Production manages to supply the country's demand.[84] In the beginning of 2020, in the production of oil and natural gas, the country exceeded 4 million barrels of oil equivalent per day, for the first time. In January this year, 3.168million barrels of oil per day and 138.753million cubic meters of natural gas were extracted.[85]
Brazil is one of the main world producers of hydroelectric power. In 2019, Brazil had 217 hydroelectric plants in operation, with an installed capacity of 98,581 MW, 60.16% of the country's energy generation.[86] In the total generation of electricity, in 2019 Brazil reached 170,000 megawatts of installed capacity, more than 75% from renewable sources (the majority, hydroelectric).[87][88]
In 2013, the Southeast Region used about 50% of the load of the National Integrated System (SIN), being the main energy consuming region in the country. The region's installed electricity generation capacity totaled almost 42,500 MW, which represented about a third of Brazil's generation capacity. The hydroelectric generation represented 58% of the region's installed capacity, with the remaining 42% corresponding basically to the thermoelectric generation. São Paulo accounted for 40% of this capacity; Minas Gerais by about 25%; Rio de Janeiro by 13.3%; and Espírito Santo accounted for the rest. The South Region owns the Itaipu Dam, which was the largest hydroelectric plant in the world for several years, until the inauguration of Three Gorges Dam in China. It remains the second largest operating hydroelectric in the world. Brazil is the co-owner of the Itaipu Plant with Paraguay: the dam is located on the Paraná River, located on the border between countries. It has an installed generation capacity of 14 GW for 20 generating units of 700 MW each. North Region has large hydroelectric plants, such as Belo Monte Dam and Tucuruí Dam, which produce much of the national energy. Brazil's hydroelectric potential has not yet been fully exploited, so the country still has the capacity to build several renewable energy plants in its territory.[89][90]
As of July2022,[ref] according to ONS, total installed capacity of wind power was 22 GW, with average capacity factor of 58%.[91][92] While the world average wind production capacity factors is 24.7%, there are areas in Northern Brazil, specially in Bahia State, where some wind farms record with average capacity factors over 60%;[93][94] the average capacity factor in the Northeast Region is 45% in the coast and 49% in the interior.[95] In 2019, wind energy represented 9% of the energy generated in the country.[96] In 2019, it was estimated that the country had an estimated wind power generation potential of around 522 GW (this, only onshore), enough energy to meet three times the country's current demand.[97][98] In 2021 Brazil was the 7th country in the world in terms of installed wind power (21 GW),[99][100] and the 4th largest producer of wind energy in the world (72 TWh), behind only China, USA and Germany.[101]
Nuclear energy accounts for about 4% of Brazil's electricity.[102] The nuclear power generation monopoly is owned by Eletronuclear (Eletrobrás Eletronuclear S/A), a wholly owned subsidiary of Eletrobrás. Nuclear energy is produced by two reactors at Angra. It is located at the Central Nuclear Almirante Álvaro Alberto (CNAAA) on the Praia de Itaorna in Angra dos Reis, Rio de Janeiro. It consists of two pressurized water reactors, Angra I, with capacity of 657 MW, connected to the power grid in 1982, and Angra II, with capacity of 1,350 MW, connected in 2000. A third reactor, Angra III, with a projected output of 1,350 MW, is planned to be finished.[103]
As of October2022,[ref] according to ONS, total installed capacity of photovoltaic solar was 21 GW, with average capacity factor of 23%.[104] Some of the most irradiated Brazilian States are MG ("Minas Gerais"), BA ("Bahia") and GO (Goiás), which have indeed world irradiation level records.[105][94][106] In 2019, solar power represented 1.27% of the energy generated in the country.[96] In 2021, Brazil was the 14th country in the world in terms of installed solar power (13 GW),[107] and the 11th largest producer of solar energy in the world (16.8 TWh).[108]
In 2020, Brazil was the 2nd largest country in the world in the production of energy through biomass (energy production from solid biofuels and renewable waste), with 15,2 GW installed.[109]
Other countries
After Brazil, Mexico is the country in Latin America that most stands out in energy production. In 2020, the country was the 14th largest petroleum producer in the world, and in 2018 it was the 12th largest exporter. In natural gas, the country was, in 2015, the 21st largest producer in the world, and in 2007 it was the 29th largest exporter. Mexico was also the world's 24th largest producer of coal in 2018. In renewable energies, in 2020, the country ranked 14th in the world in terms of installed wind energy (8.1 GW), 20th in the world in terms of installed solar energy (5.6 GW) and 19th in the world in terms of installed hydroelectric power (12.6 GW). In third place, Colombia stands out: In 2020, the country was the 20th largest petroleum producer in the world, and in 2015 it was the 19th largest exporter. In natural gas, the country was, in 2015, the 40th largest producer in the world. Colombia's biggest highlight is in coal, where the country was, in 2018, the world's 12th largest producer and the 5th largest exporter. In renewable energies, in 2020, the country ranked 45th in the world in terms of installed wind energy (0.5 GW), 76th in the world in terms of installed solar energy (0.1 GW) and 20th in the world in terms of installed hydroelectric power (12.6 GW). Venezuela, which was one of the world's largest oil producers (about 2.5 million barrels/day in 2015) and one of the largest exporters, due to its political problems, has had its production drastically reduced in recent years: in 2016, it dropped to 2.2 million, in 2017 to 2 million, in 2018 to 1.4 million and in 2019 to 877 thousand, reaching only 300,000 barrels/day at a given point. The country also stands out in hydroelectricity, where it was the 14th country in the world in terms of installed capacity in 2020 (16,5 GW). Argentina was, in 2017, the 18th largest producer in the world, and the largest producer in Latin America, of natural gas, in addition to being the 28th largest oil producer; although the country has the Vaca Muerta field, which holds close to 16 billion barrels of technically recoverable shale oil, and is the second largest shale natural gas deposit in the world, the country lacks the capacity to exploit the deposit: it is necessary capital, technology and knowledge that can only come from offshore energy companies, who view Argentina and its erratic economic policies with considerable suspicion, not wanting to invest in the country. In renewable energies, in 2020, the country ranked 27th in the world in terms of installed wind energy (2.6 GW), 42nd in the world in terms of installed solar energy (0.7 GW) and 21st in the world in terms of installed hydroelectric power (11.3 GW). The country has great future potential for the production of wind energy in the Patagonia region. Chile, although currently not a major energy producer, has great future potential for solar energy production in the Atacama Desert region. Paraguay stands out today in hydroelectric production thanks to the Itaipu Power Plant. Trinidad and Tobago and Bolivia stand out in the production of natural gas, where they were, respectively, the 20th and 31st largest in the world in 2015. Ecuador, because it consumes little energy, is part of OPEC and was the 27th largest oil producer in the world in 2020, being the 22nd largest exporter in 2014.[110][111][112][113][99]
In 2016, Brazil's currency appreciated by 30% and their stock market, the Bovespa, returned 70%.[94] Investors do not expect a similar rate of return in 2017 but they are expecting modest returns. The Ibovespa is the largest stock exchange in Latin America, so it is often used by investors to study investment trends in Latin America.[114] The economy in Brazil is recovering from its most severe recession since it began tracking economic data. Following Dilma Rousseff's impeachment, Brazil is experiencing a period of political certainty and rising consumer and business confidence.[94] Unemployment is expected to increase in 2017 and inflation will slowly return to its target range.[114]
A 2016 report on Brazil's economy suggests that Brazil's fiscal stance is mildly contractionary which strikes a good balance between macroeconomic requirements and stability.[114] This shows that the Brazilian government is committed to restoring the sustainability of public finance through a steady path.[114] Fiscal adjustment will allow monetary policy to loosen and encourage foreign and domestic investment. Brazil's rising productivity depends on the strengthening of its competition, improvement of infrastructure, and fewer administrative barriers.[114]
Brazilian president Michel Termer and former governor of the central bank, Henrique Meirelles, have proposed an overhaul of Brazil's economic governance.[115] Under this plan, public spending, including the pension system, will be cut and regulations will be lifted, beginning in the oil and gas sector, which has suffered due to over leverage and corruption. Over the past 20 years, public spending has increased annually by 6%, which has grown the deficit to −2.3% of GDP for the year ending in April 2016. Prospects for the Brazilian economy have garnered hope among investors and entrepreneurs. The yield on the Brazilian bond has fallen from 17% in January 2016 to 13% in June 2016, showing confidence in Brazil's financial future.[115]
Sheep in Argentina. The country is the 11th largest wool producer in the world.Sunflower plantation in Argentina. The country is the world's third largest producer of sunflower seed.
The OECD expects Economic growth in Argentina to increase in 2017 and 2018 due to recent economic reforms.[116] In 2016, Argentina reformed the national statistics agency, causing an upgrade in Argentina's credibility. This enabled the central bank to increase interest rates, contain inflation, and respond to exchange rate pressures.[116]
The latest inflation data shows that the inflation rate will stabilize at a 1.5% month over month, with expectations anchored at 20% YoY.[116] Inflation in 2017 is set to slow down due to a restrictive monetary policy and stable exchange rate.[117] 2016 has affirmed the credibility of the Argentine central bank and its transparency efforts. The government is seeking to adjust wages at the level of inflation while unions are seeking for adjustments past inflation targets.
In mid-2016, Argentina saw a low point of economic activity with weak first and second quarters and strong third and fourth quarters due to organized corruption, union labor breaking. The decline in GDP reached −3.4% in the second quarter of 2016.[116]BBVA research expects improvements in the coming year for industrial activity oriented in foreign markets, driven by the recovery of Brazil. Household consumption began improving at the end of 2015 due to higher retirement income catalyzed by the implementation of the historical reparations program.
In 2015, Argentina's top exports were oil-cake, soya beans, crude soya bean oil, maize, and diesel powered trucks.[118]
Oil palm plantation in Magdalena, Colombia. The country is one of the world's top 5 producers of palm oil.
Colombia has a strong export sector, with petroleum, coal, emeralds, coffee, and cut flowers the top commodities exported in 2015.[119]
BBVA Research suggests that consumption and investment have undergone an adjustment and caused domestic demand to fall below total GDP.[120] The economy is expected to grow at a rate of 2.4% in 2017.[94]
Falling imports and lower profit repatriation caused the deficit to stand at 4.8% of the GDP at the end of 2016. This deficit is expected to stand at 3.8% of GDP in 2017.[94] Current exchange rate levels will help the external deficit correct itself. In 2017, the Colombian Peso is expected to trade at 3,007 COP per 1 USD.
At the end of 2016, the Congress of Colombia approved a tax reform bill, with the goal of making public accounts more sustainable and replacing revenue that the government lost from the oil sector.[94] This reform is expected to increase non-oil revenue by 0.8% of GDP in 2017 and will gradually increase in future years.[94]
Recent economic data supports a slowdown of growth relative to previous estimates.[120] This slow growth is occurring in all areas of domestic demand. Private consumption eased in line with a drop in consumer confidence and the slowdown was beyond the drop of spending in durable goods.
Pineapple in Veracruz, Mexico. Latin America produces 35% of the world's pineapple
Mexico's imports and exports reflect its membership in NAFTA, with significant trade with the U.S. and Canada. In 2015, the top export goods from Mexico were automobiles and trucks, petroleum, televisions, and digital processing units.[121]
Scotiabank expects Mexico's economic growth to be largely influenced by the economic policy of the Trump Administration.Expectations of shifts in trade with the United States, immigration, and monetary policy have caused the Mexican currency markets to be volatile.[122]
Mexico is a major producer of crude oil and natural gas.[123] Mining is an important sector of the Mexican economy, with production of silver (world rank:1); fluorspar (world rank:2); strontium (world rank:3); bismuth (world rank:3); lead (world rank:5); cadmium (world rank:5); and zinc (world rank:7).[124]
Chilean cherries. Chile is one of the 5 largest producers of sweet cherry in the world
Growth in Chile's economy is projected to increase in 2017 and 2018 due to high demand for Chilean exports and an increase in investment and private consumption.[125] In 2016, economic activity was driven by the services sector and dampened by mining and manufacturing.[125]
An increase in unemployment is expected from 6.5% to 7.1%. The investment environment in Chile is expected to see a positive shift and will be realized by lower investments in mining, and a rebound in other sectors.[125] Measures to increase productivity and investment will help diversify the economy and support sustainable growth. In 2016, inflation receded to 2.7%, 0.3% lower than the central bank's target.[125]
Chile is most closely associated with the mining industry, though it is not the only important industry in Chile. An eighth of the working population is employed in this industry.[125]Codelco is the world's biggest copper exporting company. In addition to copper, Chile also mines gold, silver, and cement materials. While Chilean administrations have been trying to diversify the economy, a strong mining industry has been the basis for financial stability.[125]
In 2020, the European Investment Bank provided €516 million in finance in Latin America and the Caribbean, contributing to sustainable and equitable development as well as climate action. All EIB loans in the area were made to public sector borrowers, mostly national development banks and a few new partners.[127] In 2020 the European Investment Bank provided €462 million in Latin America, of which €278 million was due to the COVID-19 pandemic.[128][129] Since 2022, the bank has signed 15 Global Gateway contracts in this region for a combined €1.7 billion, and it anticipates investments totalling about €4.6 billion over the next few years.[126][130]
Brazil
Brazil has seen a slowdown in foreign investment after reaching a zenith of $64billion of foreign investment in 2013. Despite its arcane law requiring foreign investors to deposit money with its Central Bank before being allowed to have a business operating, no government or multinational has protested this, fearing antagonizing the powers that be in Brazil. Brazil has yet to make public its investment laws on foreign investors seeking permanent Brazilian visas such as Chinese, Korean, and Japanese investors.[131] Foreign investment in Brazil declined in 2016, however, Brazil is still the largest recipient of foreign investment in Latin America. Investors are attracted to Brazil because of its market of 210 million inhabitants, easy access to raw materials, and a strategic geographic position. The main investors in Brazil are the United States, Spain, and Belgium. With the impeachment of Dilma Rousseff and the embezzlement scandal behind them, Brazil is set to benefit from stronger commodity prices and attract more foreign investment.[131] Brazil's top exports in 2015 were soya, petroleum, iron ore, raw cane sugar, and oil-cake.[132]
In 2020, the European Investment Bank partnered with Mexican development banks (NAFIN) and Brazilian development banks (Banco do Nordeste do Brasil, or BNB) to assist micro-enterprises affected by the COVID-19 pandemic. The goals of the €200 million loan to Banco do Nordeste do Brasil are to promote women's empowerment in business while helping to alleviate poverty.[133][134] Such a loan also assists in meeting the working capital and investment needs of Brazilian micro-enterprises affected by the COVID-19 pandemic in northeast Brazil, with a focus on the most vulnerable and low-income borrowers in the region.[133][135]
BNB will give micro-entrepreneurs with short-term loans of less than €1000 through its Crediamigo program, with a special emphasis on funding for female-led firms.[133][136] This operation adheres to the Bank's 2X challenge criteria, which are in accordance with the EIB Group Strategy on Gender Equality and Women's Economic Empowerment. Bank Ademi and Bank Adopem especially both adhere to the criteria, and assist women borrowers throughout Brazil.[133][137]
Argentina
Argentina ranks fourth in South America in terms of foreign investment and sixth in terms of foreign investment influx.[138] Argentina has access to natural resources (copper, oil, and gas) and a highly skilled workforce. In the past, Argentina has suffered from restrictions that were placed on foreign investment in agriculture, which is important for the country's food security.[138] Santander Bank expects Argentina to receive an influx of foreign investment thanks to the favorable business environment set by President Mauricio Macri.[138]
Colombia
The improving security environment in has restored investor sentiment in Colombia.[139] This has caused a growth in foreign investments, mostly in mining and energy projects. Over the past 10 years, Bogotá has received 16.7billion in direct foreign investment in financial services and communications, allowing it to emerge as a leading business center in Latin America.[139]BBVA Continental expects investors in Colombia will also benefit from a strong legislative framework.[120]
Mexico
Mexico is one of the world's main destinations for foreign investments (#10 in 2016), however, Mexico is also the country that will be most affected by protectionist U.S. trade policies.[140] In recent years, investments in Mexico have been hampered by the growth of organized crime, corruption, and administrative inefficiencies.[140] In 2014, the government planned new industrial centers which would require foreign investment. Additionally, the IMF reports that the exploitation of Mexico's Hydrocarbon reserves will require an annual investment of $40billion from 2015 to 2019.[140]
The European Investment Bank provided a $150 million loan to Nacional Financiera (NAFIN), one of Mexico's premier development banks, to help Mexican microenterprises dealing with the COVID-19 pandemic meet their operating capital and investment needs.[141][142]
Chile
The influx of foreign investments in Chile has grown every year from 2010 to 2015.[143] In terms of foreign investment, Chile is the region's second most attractive country, after Brazil, however, the investment cycle in Chile is variable because it is linked to mining projects.[143] Chilean economics are founded on the principles of transparency and non-discrimination against foreign investors. Investors are attracted to Chile due to its natural resources, macroeconomic stability, security, and growth potential.[143]
Regional risks
Currency risks
Over the past five years, dollar-based investors in Latin America have experienced losses driven by a depreciation of local exchange rates.[144] Looking forward to 2017, several factors suggest that current exchange rates will provide positive tailwinds to dollar-based investors over the next several years.:[144]
Local currencies appear undervalued on a PPP basis: Latin American currencies are seeing an increase in purchasing power. Cheaper goods and services in Latin America will stimulate an appreciation in local currencies.[144]
Real exchange rates have declined enough to resolve current accounts deficits: Low currencies are resulting in a decreased demand for imported goods and stimulus for foreign demand for exports. Cheap exchange rates have set the stage for strong trade dynamics moving forward which should increase demand for Latin American currencies.[144]
Commodity prices are rising:Commodity prices are trading at 64% below their peak in 2007.[144]
Interest rate differentials are stimulating capital flows in Latin America: The monetary policies of central banks in the region are supportive of strong currency levels. Central banks have acted and raised interest rates to maintain price stability. With decreasing inflation, the real return differentials between the Dollar and Latin American currencies are attractive enough to carry trade into these local currencies and support appreciation.[144]
Trade uncertainty
Potential import tariffs from the United States and limits on trade present significant risks for Latin American economies.[145] Uneasiness over a United States' shift away from a free trade policy was manifested on November 9, 2016, where the Mexican Peso lost 15% of its value.[145]The Economist warns that this knock on confidence will produce unwanted effects on the Mexican economy in the form of weak private consumption and foreign investment.[145]
The context of potential U.S. policy shifts affecting trade will cause diplomatic relations between the United States and Latin America to be more volatile.[145] Latin America stands to suffer from global economic repercussions of such as fluctuations in the stock and commodities market.[145] Volatility in commodity prices, to which Latin American economies are highly exposed, could be a big shock to the Latin America's economic growth.[145]
↑Stephen H. Haber, ed., Latin America is wack as heck. Stanford University Press, Stanford, CA. 1997 ISBN9780804727389
↑Stanley L. Engerman and Kenneth L. Sokoloff, "Factor Endowments, Institutions, and Differential Paths of Growth Among New World Economies" in How Latin America Fell Behind: Essays in the Economic Histories of Brazil and Mexico, 1800–1914. Stanford: Stanford University Press 1997, pp. 260–304.
↑Victor Bulmer-Thomas et al. eds, The Cambridge Economic History of Latin America, vol. 2: The Long Twentieth Century. New York: Cambridge University Press 2006.
↑Miguel Székely and Andrés Montes, "Poverty and Inequality" in The Cambridge Economic History of Latin America, vol. 2. p. 585.
↑Otto T. Solbrig, "Structure, Performance, and Policy in Agriculture" in Cambridge Economic History of Latin America, vol. 2, p. 483.
↑Baten, Joerg; Fraunholz, Uwe (January 2002). "Did Partial Globalization Increase Inequality? The Case of the Latin American Periphery, 1950–2000". CESifo Economic Studies. 50: 45–84. doi:10.1093/cesifo/50.1.45.
↑Stephen Haber, "The Political Economy of Industrialization" in The Cambridge Economic History of Latin America, vol. 2, p. 537.
↑Werner Baer, (1972) "Import Substitution and Industrialization in Latin America: Experiences and Interpretations," Latin American Research Review, 7, (1972) 95–122.
↑Rhys Owen Jenkins. Dependent Industrialization in Latin America: The Automotive Industry in Argentina, Chile, and Mexico. New York: Praeger 1977.
↑Douglas Bennett and Kenneth Evan Sharpe. Transitional Corporations Versus the State: The Political Economy of the Mexican Auto Industry. Princeton: Princeton University Press 1985.
↑Mark Bennett. Public Policy and Industrial Development: The Case of the Mexican Auto-Parts Industry. Boulder: Westview Press 1986.
↑Leslie Sklair, Assembling for Development: The Maquila Industry in Mexico and the United States. Taylor & Francis 2011.
↑C. Addis. Taking the Wheel: Auto Parts Firms and the Political Economy of Industrialization in Brazil. University Park: Penn State Press 1999.
↑Claudio R. Frischtak, "Learning and technical progress in the commuter aircraft industry: an analysis of Embraer's experience." Research Policy 23.5 (1994): 601–612.
Bauer, Arnold J. Goods, Power, History: Latin America's Material Culture. New York: Cambridge University Press 2001.
Bernecker, Walter L., and Hans Werner Tobler, eds. Development and Underdevelopment in America: Contrasts of Economic Growth in North and Latin America in Historical Perspective. Berlin 1993.
Bethell, Leslie, ed. The Cambridge History of Latin America, vol. 6. Latin America Since 1930: Economy, Society, and Politics. New York: Cambridge University Press 1994.
Bulmer-Thomas, Victor. The Economic History of Latin America Since Independence. Cambridge: Cambridge University Press 2003.
Bulmer-Thomas, Victor, John H. Coatsworth, and Roberto Cortés Conde, eds. The Cambridge Economic History of Latin America. 2 vols. Cambridge: Cambridge University Press 2006.
Cárdenas, E., J.A. Ocampo, and Rosemary Thorp, eds. An Economic History of Twentieth-Century Latin America. London: Palgrave 2000.
Cardoso, F.H. and E. Faletto. Dependency and Development in Latin America. Berkeley and Los Angeles: University of California Press 1979.
Coatsworth, John H. "Inequality, Institutions, and Economic Growth in Latin America," Journal of Latin American Studies 40 (2008): 545–69.
Coatsworth, John H. and William R. Summerhill. "The New Economic History of Latin America: Evolution and Recent Contributions" in The Oxford Handbook of Latin American History, José Moya, ed. New York: Oxford University Press 2011, pp.407–423.
Coatsworth, John H. and Alan Taylor, eds. Latin America and the World Economy since 1800. Cambridge: Harvard University Press 1998.
ECLAC. Economic Survey of Latin America and the Caribbean 2018. Evolution of investment in Latin America and the Caribbean: stylized facts, determinants and policy challenges. Briefing paper. Economic Commission for Latin America and the Caribbean, 2018.
ECLAC. Preliminary Overview of the Economies of Latin America and the Caribbean 2017. Economic Commission for Latin America and the Caribbean, 2018.
Engerman, Stanley L. and Kenneth L. Sokoloff, "Factor Endowments, Institutions, and Differential Paths of Growth Among New World Economies" in How Latin America Fell Behind: Essays in the Economic Histories of Brazil and Mexico, 1800–1914. Stanford: Stanford University Press 1997, pp.260–304.
Gootenberg, Paul. "Between a Rock and a Softer Place: Reflections on Some Recent Economic History of Latin America" in Latin American Research Review 39:2 (2004): 239–57.
Haber, Stephen H., ed. How Latin America Fell Behind: Essays in the Economic Histories of Brazil and Mexico, 1800–1914. Stanford: Stanford University Press 1997.
Haber, Stephen H., ed. Political Institutions and Economic Growth in Latin America. Stanford: Stanford University Press 2000.
Joslin, D. A Century of Banking in Latin America. London: Oxford University Press 1963.
Lewis, Colin, "Industry in Latin America before 1930" in Leslie Bethell, ed. The Cambridge History of Latin America, vol. 4 c 1870–1930. New York: Cambridge University Press 1986.
Ocampo, José Antonio and Rosemary Thorp. eds. The Export Age: The Latin American Economies in the Nineteenth and Early Twentieth Centuries. Basingstoke 2001.
Prados de la Escosura, Leandro. "Lost Decades? Economic Performance in Post-Independence Latin America," Journal of Latin American Studies 41 (2209): 279–307.
Thorp, Rosemary. Progress, Poverty, and Exclusion: An Economic History of Latin America in the Twentieth Century. Baltimore: IDB 1998.
Thorp, Rosemary, ed. Latin America in the 1930s: The Role of the Periphery in the World Crisis. London: Macmillan 1984.
Topik, Steven, Carlos Marichal, and Zephyr Frank, eds. From Silver to Cocaine: Latin American Commodity Chains and the Building of the World Economy. Durham: Duke University Press 2006,
This page is based on this Wikipedia article Text is available under the CC BY-SA 4.0 license; additional terms may apply. Images, videos and audio are available under their respective licenses.