List of Chinese administrative divisions by sex ratio

Last updated

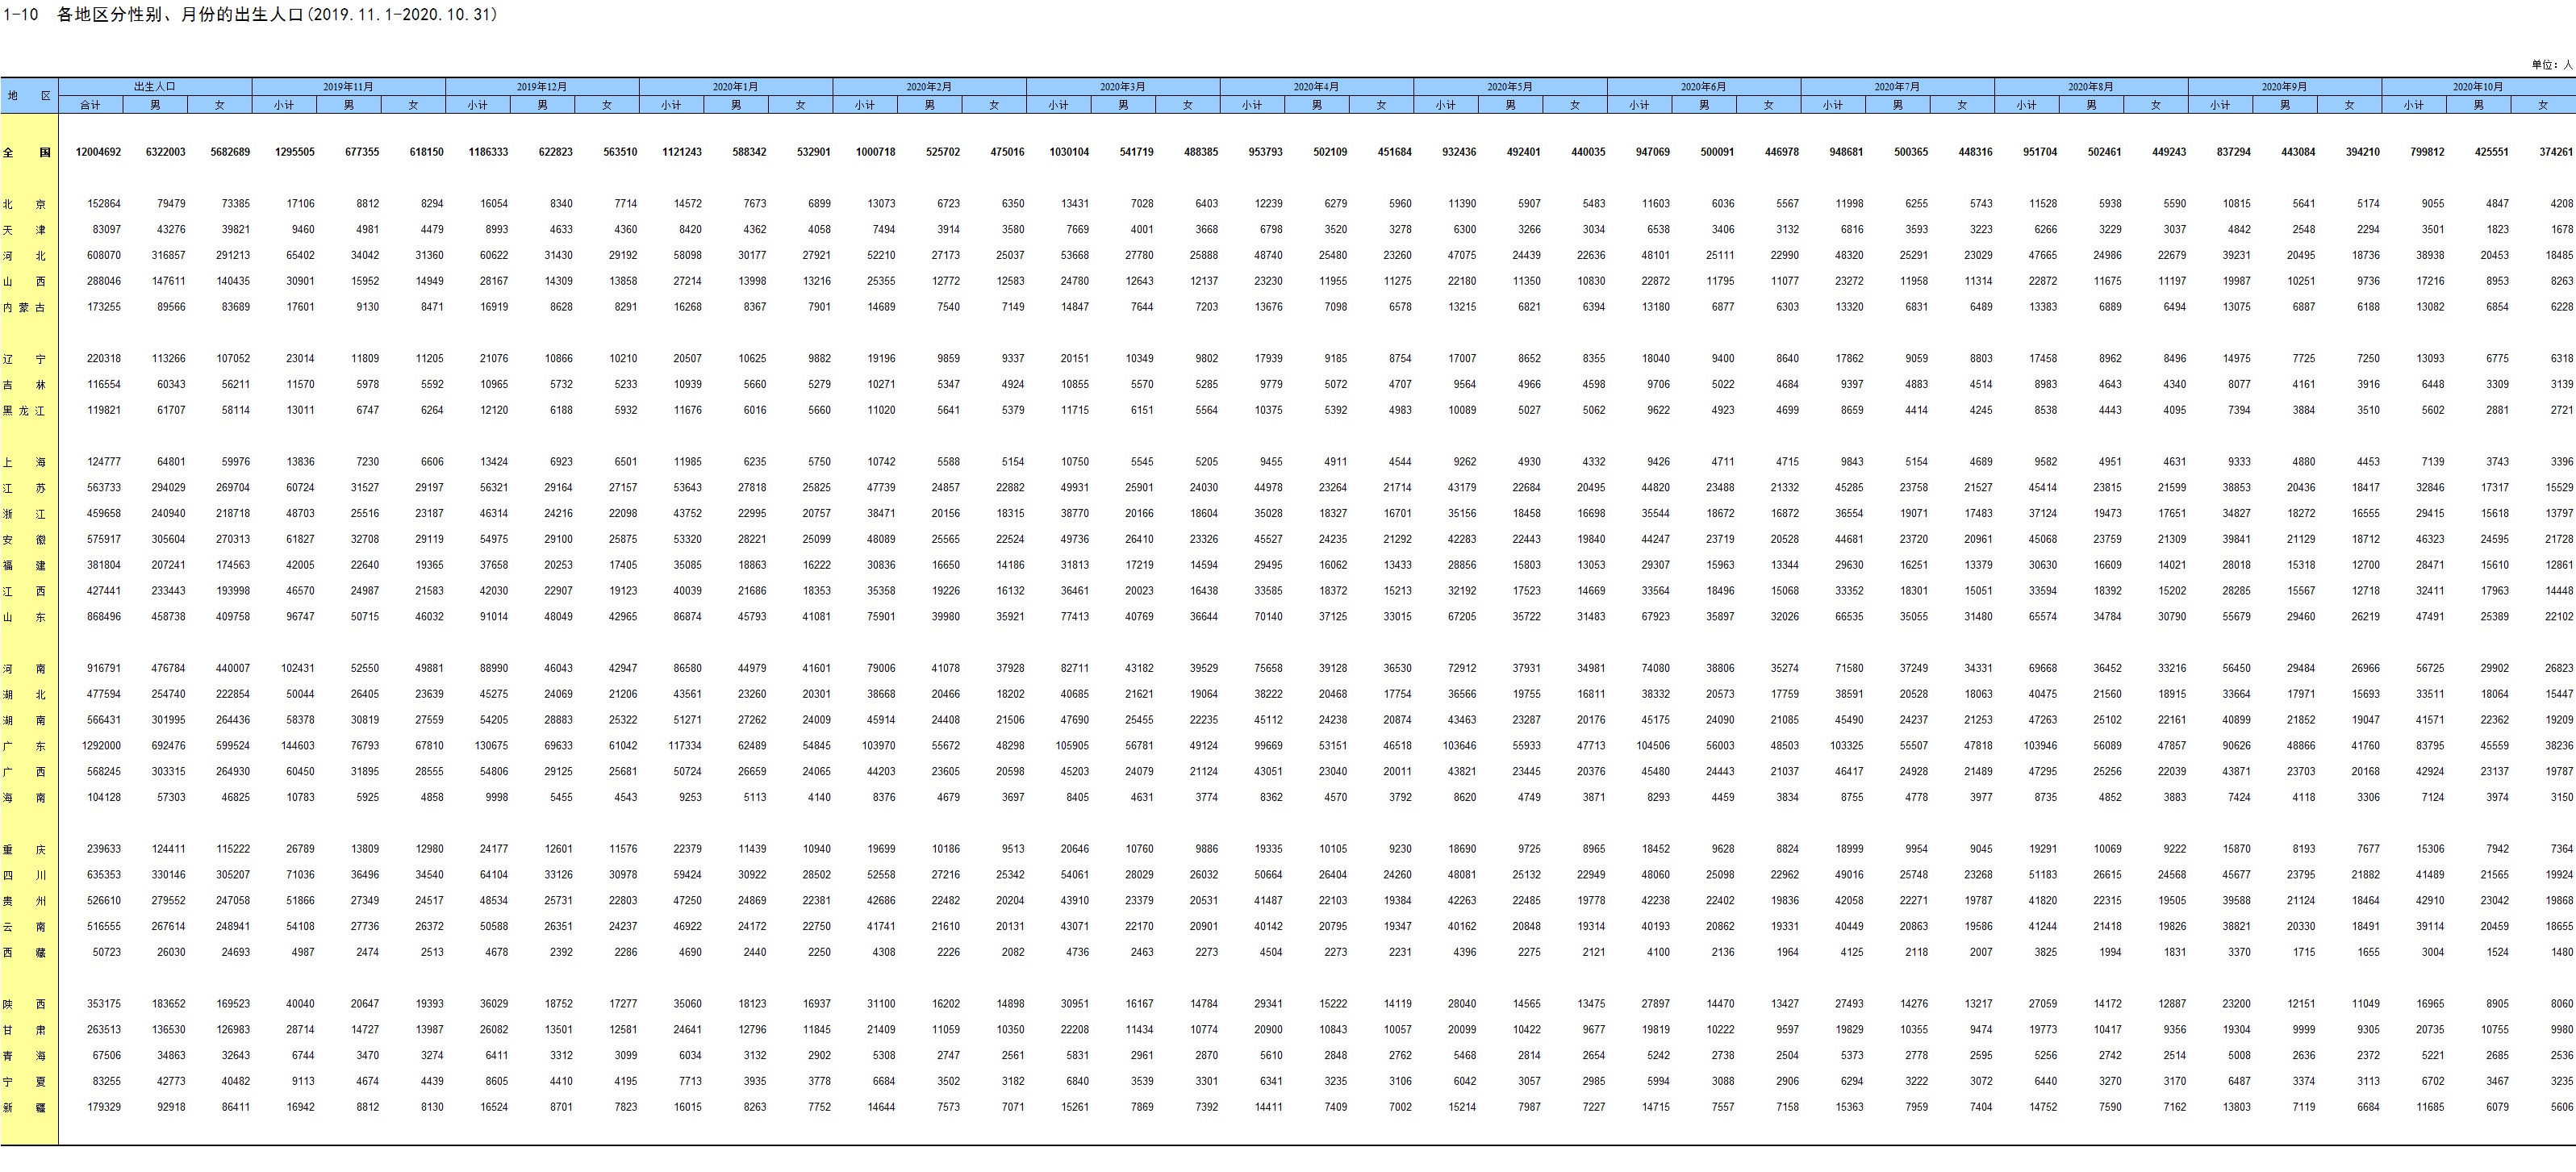
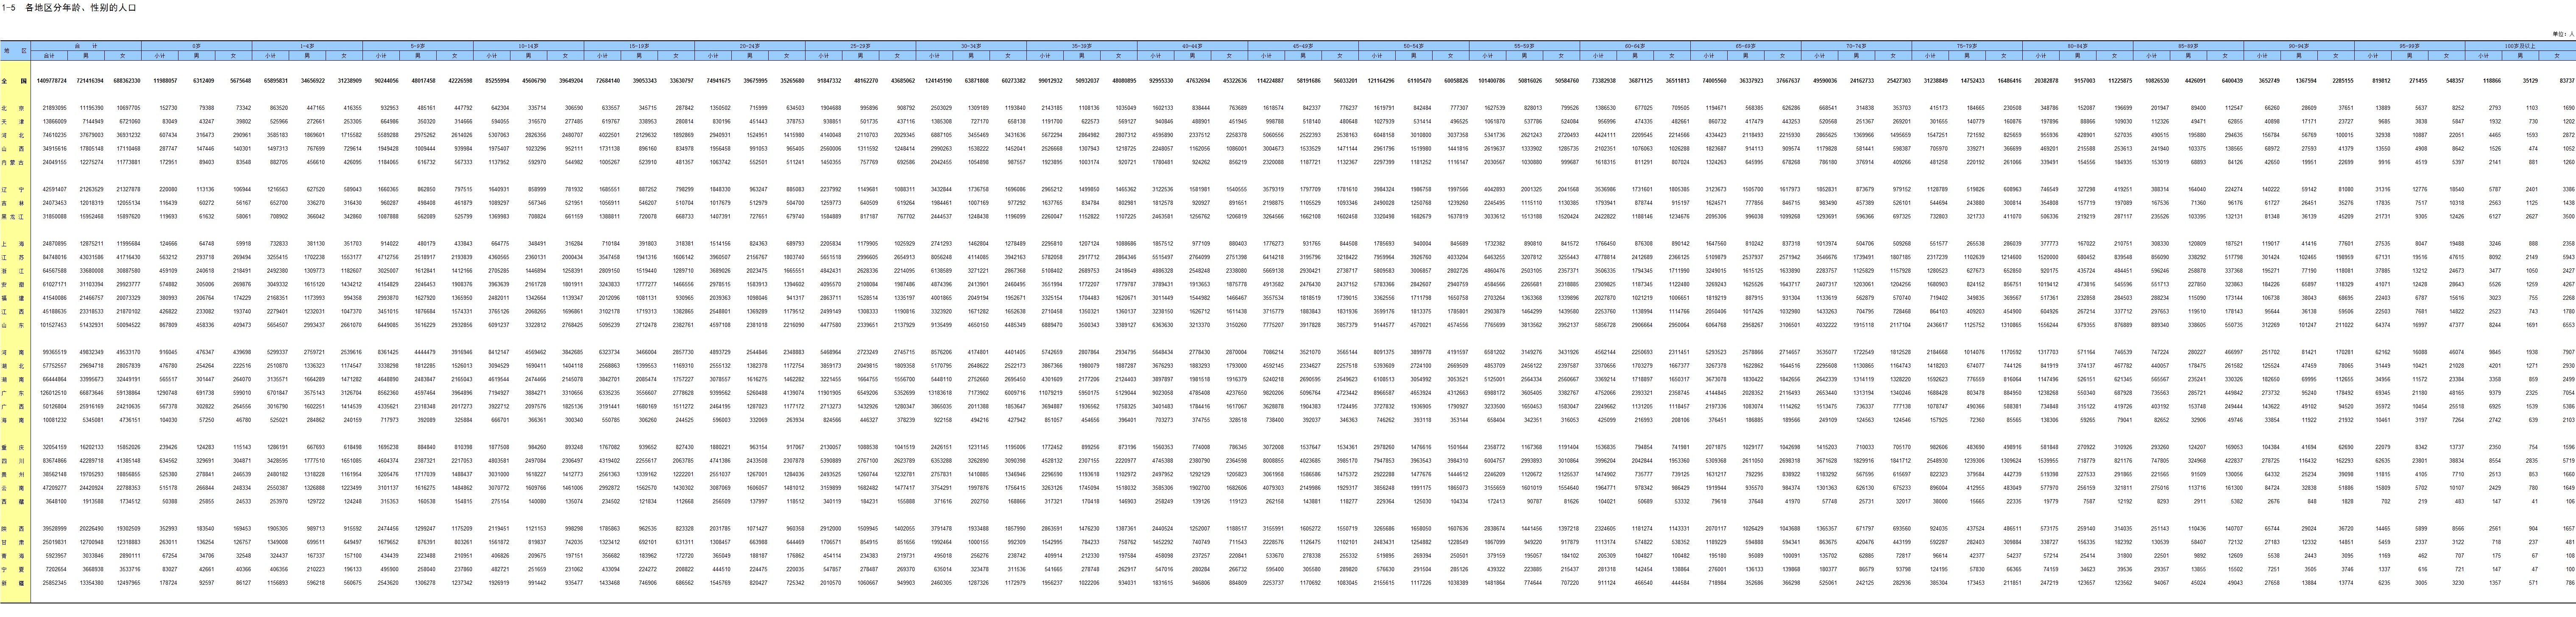
The sex ratio of the different administrative divisions of China has been the subject of academic study because of a high imbalance in births since the 1990s[ citation needed ] and female infanticide further worsening the imbalanced sex ratios at birth.

Contents

Gender ratio (males every 100 females) at birth

Color Regions of China
North China
East China
Southwestern China
Northwestern China
South Central China
Northeast China
NameRegion19902000 [1] 2010 [2] 2020 [3]
Beijing North China 107.5110.6109.5108.3
Tianjin North China 110.1112.5113.7108.7
Hebei North China 112.5113.4114.9108.8
Shanxi North China 109.6112.5110.2105.1
Inner Mongolia North China 108.3108.5112.1107.0
Liaoning Northeast China 110.2112.8110.2105.8
Jilin Northeast China 108.7111.2111.2107.4
Heilongjiang Northeast China 107.3109.7112.4106.2
Shanghai East China 104.8110.6111.1108.0
Jiangsu East China 115.0116.5116.2109.0
Zhejiang East China 117.6113.9118.1110.2
Anhui East China 110.9127.8128.6113.1
Fujian East China 110.3117.9125.6118.7
Jiangxi East China 110.8114.7122.8120.3
Shandong East China 115.1112.2119.4112.0
Henan South Central China 116.2118.5117.8108.4
Hubei South Central China 109.6128.2124.1114.3
Hunan South Central China 110.2126.2123.2114.2
Guangdong South Central China 112.0130.3120.3115.5
Guangxi South Central China 116.9125.5122.7114.5
Hainan South Central China 114.9135.6125.3122.4
Chongqing Southwestern China 112.0115.1112.5108.0
Sichuan Southwestern China 116.0111.6108.2
Guizhou Southwestern China 101.2107.0122.1113.2
Yunnan Southwestern China 107.4108.7111.8107.5
Tibet Southwestern China 103.2102.7106.6105.4
Shaanxi Northwestern China 111.3122.1115.3108.3
Gansu Northwestern China 110.8114.8117.4107.5
Qinghai Northwestern China 104.4110.4112.4106.8
Ningxia Northwestern China 107.0108.8113.9105.7
Xinjiang Northwestern China 104.7106.1106.1107.5
Flag of the People's Republic of China.svg Mainland China 111.4116.9117.9111.3
Flag of Hong Kong.svg Hong Kong [4] 105.9109.3115.0109.2
Flag of Macau.svg Macau [5] 110.4111.7108.1107.0

Gender ratio at ages 1-4

The figures are from the 2000 census, intercensus survey of 2005 (which was carried out in November 2005 on a representative 1% of the total population), 2010 census, and 2020 census. [6]

Figures for Hong Kong are from the 2001 census, 2011 census, and the 2021 census conducted separately by Census and Statistics Department of Hong Kong.

Mainland China

NameRegion2000 [7] 2005 [6] 2010 [8] 2020 [9]
Jiangxi East China 136.7143131.7117.6
Henan South Central China 136.4142126.6108.7
Anhui East China 129.9138126.3112.6
Hainan South Central China 135.7134125.0118.6
Hunan South Central China 123.8133120.6113.1
Guangdong South Central China 129.2133122.9114.3
Hubei South Central China 129.1129123.4113.8
Guizhou Southwestern China 115.4127124.3113.4
Shaanxi Northwestern China 126.6125117.1108.1
Jiangsu East China 124.2123121.4109.6
Hebei North China 116.2122116.9109.0
Guangxi South Central China 128.0122120.0113.3
Gansu Northwestern China 120.0120118.2107.7
Fujian East China 125.2119124.4118.1
Chongqing Southwestern China 117.0119112.6108.0
Tianjin North China 112.6118113.3107.6
Sichuan Southwestern China 115.1116110.9107.7
Shandong East China 114.9116123.3112.5
Yunnan Southwestern China 113.6115112.7108.5
Liaoning Northeast China 113.1114110.7106.5
Zhejiang East China 113.7113115.0110.8
Beijing North China 110.9112111.3107.4
Shanxi North China 110.4112110.5105.2
Jilin Northeast China 110.7112111.7106.3
Ningxia Northwestern China 109.0112112.8107.2
Heilongjiang Northeast China 108.6111110.6106.8
Qinghai Northwestern China 108.1111108.7106.5
Shanghai East China 110.2109114.6108.4
Inner Mongolia North China 109.7107110.2107.2
Xinjiang Northwestern China 105.6106105.5106.3
Tibet Southwestern China 101.1104104.8104.4
Mainland China120.8124119.4110.9

Hong Kong

Name200120112021
Flag of Hong Kong.svg Hong Kong 109.2 [10] 108.2 [11] 105.4 [12]

See also

References

  1. "表1—12 省、自治区、直辖市分性别、月份的出生人口(1999.11.1-2000.10.31)" [Table 1-12 Births by gender and month by provinces, autonomous regions, and directly-administered municipalities]. www.stats.gov.cn (in Chinese). Retrieved 2025-07-15.
  2. "1-12 各地区分性别、月份的出生人口(2009.11.1-2010.10.31)" [1-12 Births by gender and month by regions (2009.11.1-2010.10.31)]. www.stats.gov.cn (in Chinese). Retrieved 2025-07-15.
  3. "1-10 各地区分性别、月份的出生人口(2019.11.1-2020.10.31)" [1-10 Births by gender and month by regions (2019.11.1-2020.10.31)]. www.stats.gov.cn (in Chinese). Retrieved 2025-07-15.
  4. "Table 115-01011: Vital Events". Census and Statistics Department . Retrieved 2025-07-15.
  5. "Time Series Database". DSEC. Retrieved 2025-07-15.
  6. 1 2 Wei Xing Zhu; Li Lun; Therese Hesketh (9 April 2009). "China's excess males, sex selective abortion, and one child policy: analysis of data from 2005 national intercensus survey". British Medical Journal . 338 b1211. doi:10.1136/bmj.b1211. PMC   2667570 . PMID   19359290.
  7. "表1—7 省、自治区、直辖市分性别、年龄的人口" [Table 1-7 Population by Provinces, Autonomous Regions, and Directly Administered Municipalities by Age and Gender]. www.stats.gov.cn (in Chinese). Retrieved 2025-07-14.
  8. "1-7 各地区分年龄、性别的人口" [1-7 Population by regions by age and gender]. www.stats.gov.cn (in Chinese). Retrieved 2025-07-14.
  9. "1-5 各地区分年龄、性别的人口" [1-5 Population by regions by age and gender]. www.stats.gov.cn (in Chinese). Retrieved 2025-07-14.
  10. Table E2001F: 2001 Population Census - Main Tables (Population Sub-group) (Report). Census and Statistics Department. 2001. Archived from the original on 2023-01-25. Retrieved 2025-07-14.
  11. Table E2011F: 2011 Population Census - Main Tables (Population Sub-group) (Report). Census and Statistics Department. 2001. Usual Residents by Sex, Age and Marital Status, 2011 (F104). Archived from the original on 2023-01-25. Retrieved 2025-07-14.
  12. Table E2021A: 2021 Population Census - Main Tables (Demographic) (Report). Census and Statistics Department. 2021. Table A118a : Population by Age, Year, Sex and Marital Status. Archived from the original on 2025-04-06. Retrieved 2025-07-14.