List
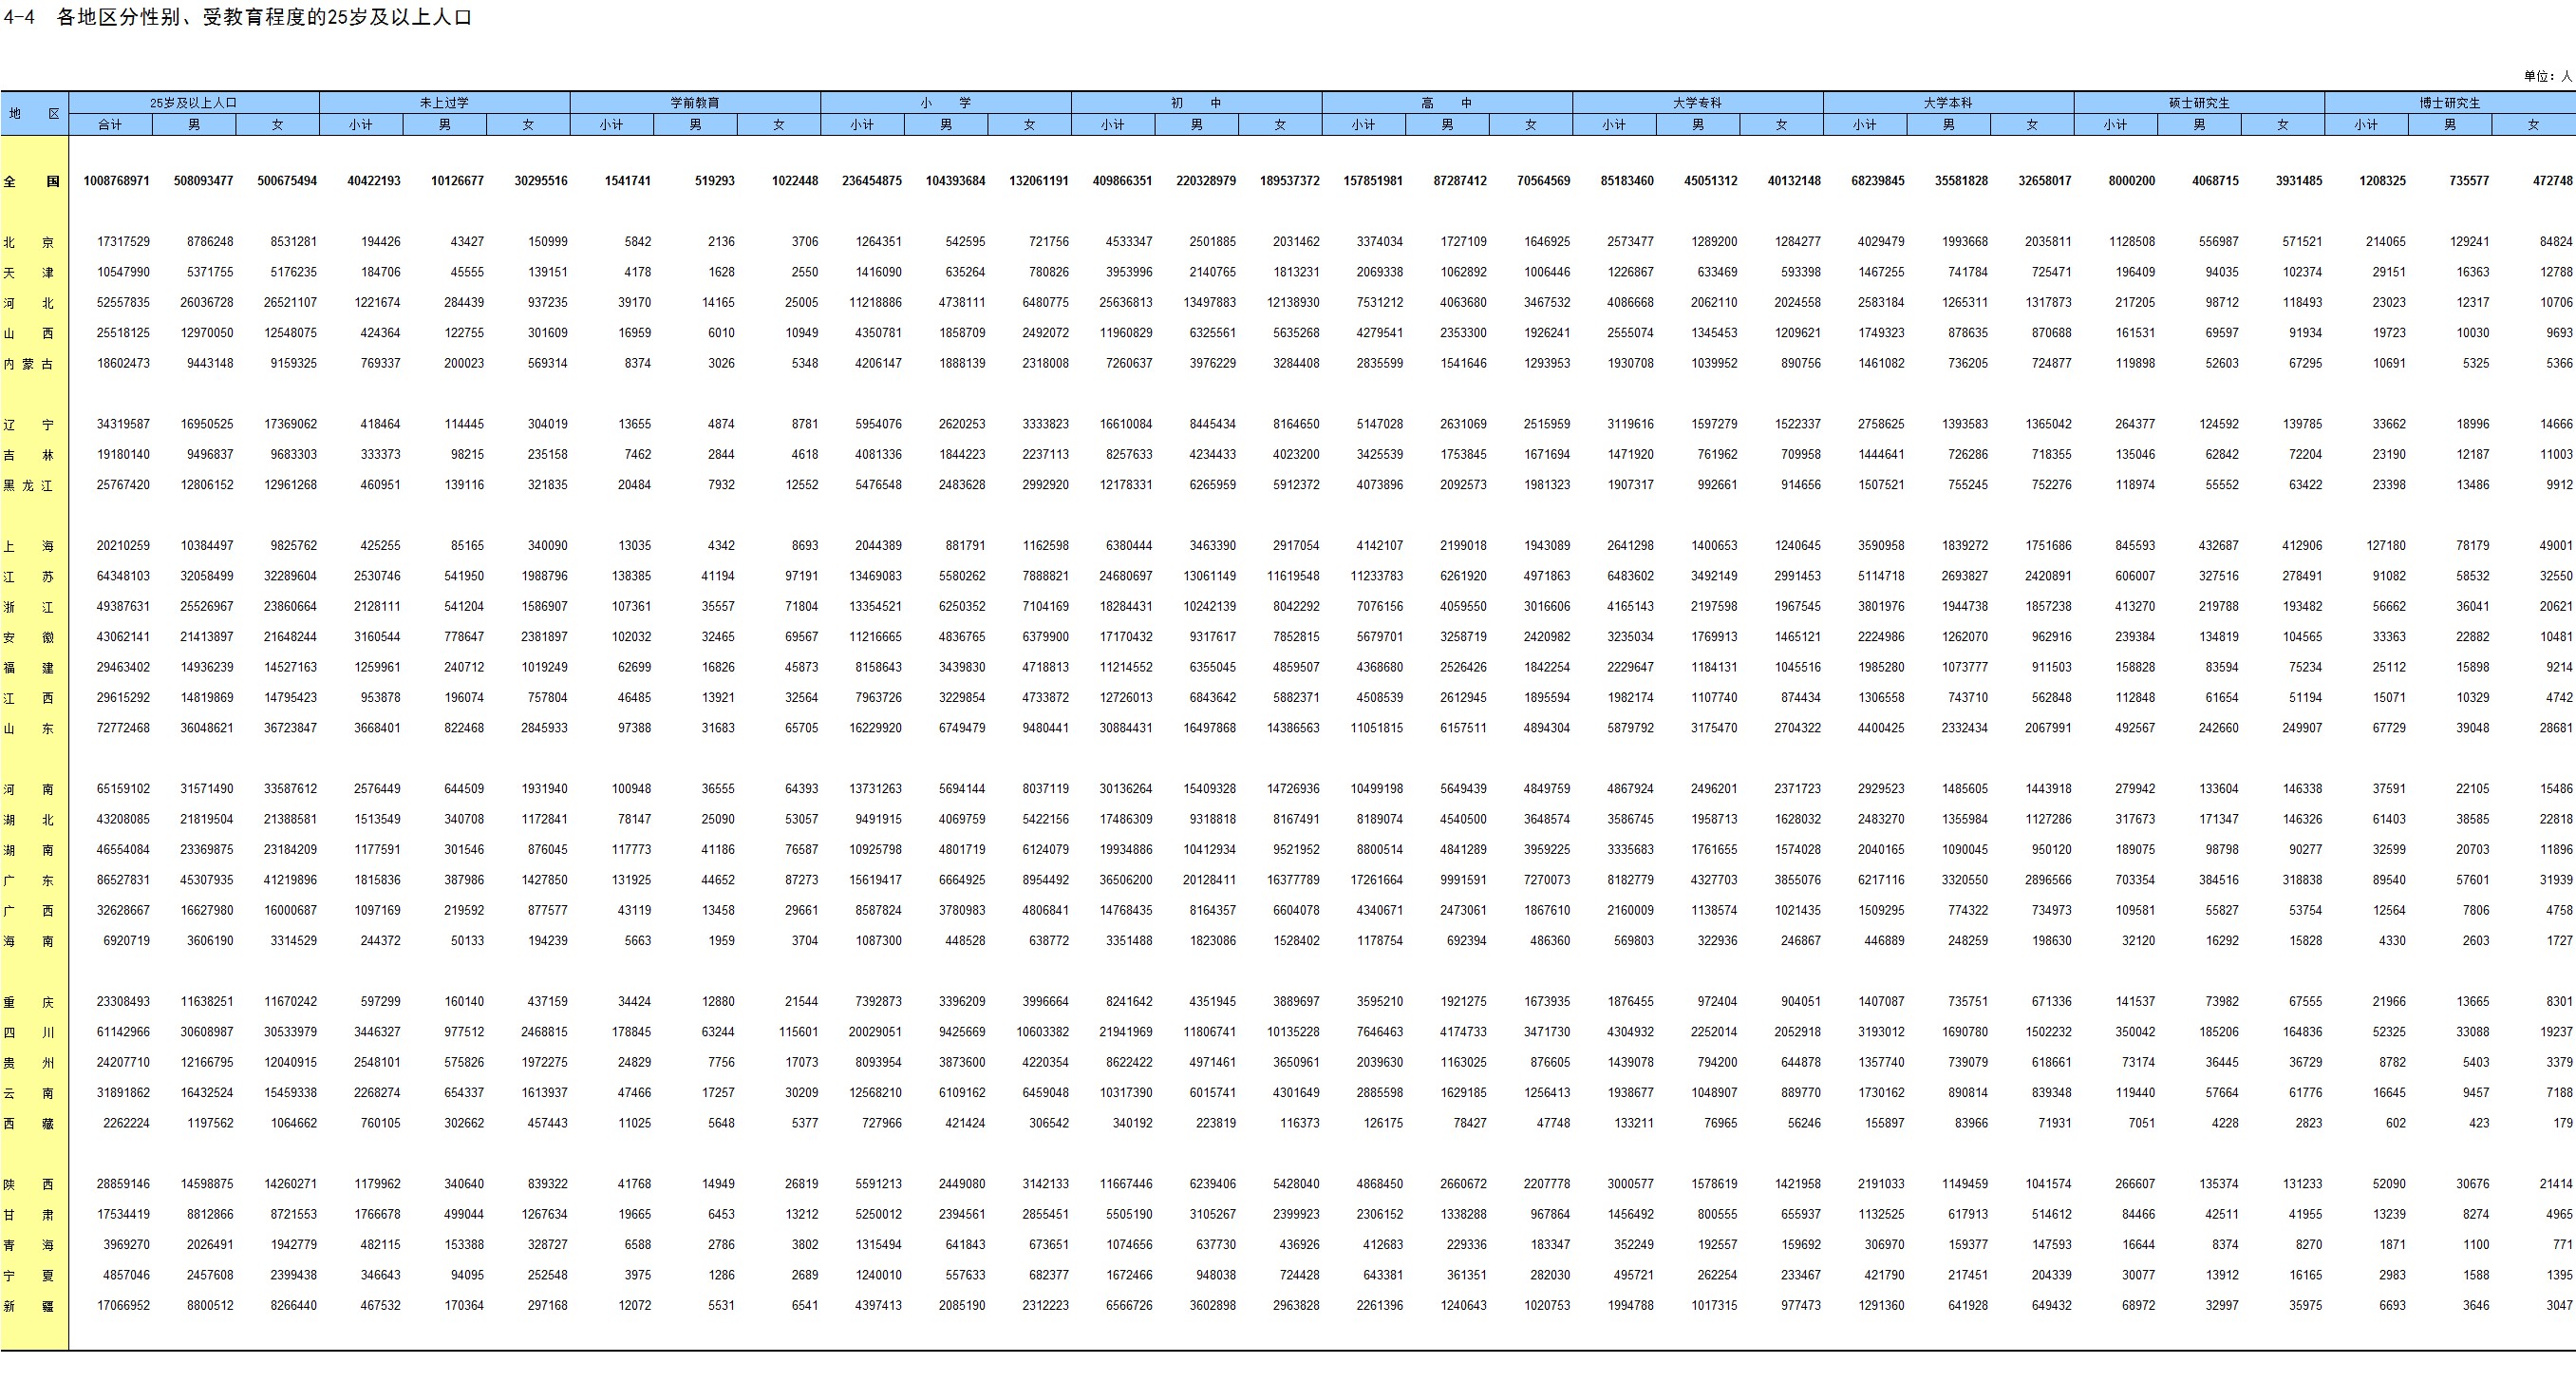
| Name | Total Population | Basic Education | Upper Secondary Education | Tertiary Education | |||
|---|---|---|---|---|---|---|---|
| # | % | # | % | # | % | ||
| 1,008,768,971 | 730,350,162 | 72.40% | 320,483,811 | 31.77% | 162,631,830 | 16.12% | |
| Beijing | 17,317,529 | 15,852,910 | 91.54% | 11,319,563 | 65.36% | 7,945,529 | 45.88% |
| Tianjin | 10,547,990 | 8,943,016 | 84.78% | 4,989,020 | 47.30% | 2,919,682 | 27.68% |
| Hebei | 52,557,835 | 40,078,105 | 76.26% | 14,441,292 | 27.48% | 6,910,080 | 13.15% |
| Shanxi | 25,518,125 | 20,726,021 | 81.22% | 8,765,192 | 34.35% | 4,485,651 | 17.58% |
| Inner Mongolia | 18,602,473 | 13,618,615 | 73.21% | 6,357,978 | 34.18% | 3,522,379 | 18.94% |
| Liaoning | 34,319,587 | 27,933,392 | 81.39% | 11,323,308 | 32.99% | 6,176,280 | 18.00% |
| Jilin | 19,180,140 | 14,757,969 | 76.94% | 6,500,336 | 33.89% | 3,074,797 | 16.03% |
| Heilongjiang | 25,767,420 | 19,809,437 | 76.88% | 7,631,106 | 29.62% | 3,557,210 | 13.81% |
| Shanghai | 20,210,259 | 17,727,580 | 87.72% | 11,347,136 | 56.15% | 7,205,029 | 35.65% |
| Jiangsu | 64,348,103 | 48,209,889 | 74.92% | 23,529,192 | 36.57% | 12,295,409 | 19.11% |
| Zhejiang | 49,387,631 | 33,797,638 | 68.43% | 15,513,207 | 31.41% | 8,437,051 | 17.08% |
| Anhui | 43,062,141 | 28,582,900 | 66.38% | 11,412,468 | 26.50% | 5,732,767 | 13.31% |
| Fujian | 29,463,402 | 19,982,099 | 67.82% | 8,767,547 | 29.76% | 4,398,867 | 14.93% |
| Jiangxi | 29,615,292 | 20,651,203 | 69.73% | 7,925,190 | 26.76% | 3,416,651 | 11.54% |
| Shandong | 72,772,468 | 52,776,759 | 72.52% | 21,892,328 | 30.08% | 10,840,513 | 14.90% |
| Henan | 65,159,102 | 48,750,442 | 74.82% | 18,614,178 | 28.57% | 8,114,980 | 12.45% |
| Hubei | 43,208,085 | 32,124,474 | 74.35% | 14,638,165 | 33.88% | 6,449,091 | 14.93% |
| Hunan | 46,554,084 | 34,332,922 | 73.75% | 14,398,036 | 30.93% | 5,597,522 | 12.02% |
| Guangdong | 86,527,831 | 68,960,653 | 79.70% | 32,454,453 | 37.51% | 15,192,789 | 17.56% |
| Guangxi | 32,628,667 | 22,900,555 | 70.19% | 8,132,120 | 24.92% | 3,791,449 | 11.62% |
| Hainan | 6,920,719 | 5,583,384 | 80.68% | 2,231,896 | 32.25% | 1,053,142 | 15.22% |
| Chongqing | 23,308,493 | 15,283,897 | 65.57% | 7,042,255 | 30.21% | 3,447,045 | 14.79% |
| Sichuan | 61,142,966 | 37,488,743 | 61.31% | 15,546,774 | 25.43% | 7,900,311 | 12.92% |
| Guizhou | 24,207,710 | 13,540,826 | 55.94% | 4,918,404 | 20.32% | 2,878,774 | 11.89% |
| Yunnan | 31,891,862 | 17,007,912 | 53.33% | 6,690,522 | 20.98% | 3,804,924 | 11.93% |
| Tibet | 2,262,224 | 763,128 | 33.73% | 422,936 | 18.70% | 296,761 | 13.12% |
| Shaanxi | 28,859,146 | 22,046,203 | 76.39% | 10,378,757 | 35.96% | 5,510,307 | 19.09% |
| Gansu | 17,534,419 | 10,498,064 | 59.87% | 4,992,874 | 28.47% | 2,686,722 | 15.32% |
| Qinghai | 3,969,270 | 2,165,073 | 54.55% | 1,090,417 | 27.47% | 677,734 | 17.07% |
| Ningxia | 4,857,046 | 3,266,418 | 67.25% | 1,593,952 | 32.82% | 950,571 | 19.57% |
| Xinjiang | 17,066,952 | 12,189,935 | 71.42% | 5,623,209 | 32.95% | 3,361,813 | 19.70% |
| 5,700,078 | 4,517,096 | 79.25% | 3,517,749 | 61.71% | 1,902,966 | 33.39% | |
| 418,160 | 234,735 | 56.14% | 133,499 | 31.93% | |||