List of Chinese administrative divisions by disposable income per capita

Last updated

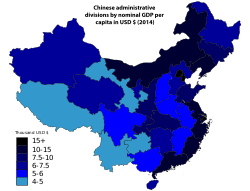
This is a list of the first-level administrative divisions of the People's Republic of China (PRC), including all provinces, autonomous regions and municipalities, in order of their total disposable income per capita in 2014. The figures are given in Renminbi. Hong Kong SAR, and Macau SAR are excluded.

Chinese administrative divisions by disposable income per capita in 2014. China- Disposable income per capita (USD).svg
Chinese administrative divisions by disposable income per capita in 2014.
Chinese administrative divisions by nominal GDP per capita in 2014. China- Nominal GDP per capita (USD).svg
Chinese administrative divisions by nominal GDP per capita in 2014.

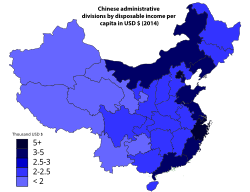
Disposable income is total personal income minus personal current taxes. In national accounts definitions, personal income, minus personal current taxes equals disposable personal income. Subtracting personal outlays (which includes the major category of personal (or, private) consumption expenditure) yields personal (or, private) savings.

In 2014, the average exchange rate between RMB (CNY) and USD is 6.1428 : 1.

2014 RankProvinceDisposable Income per capita RMB¥ Disposable Income per capita USD$ Nominal GDP per capita USD$ Average Household SizeDisposable Income per household RMB¥ Disposable Income per household USD$
1 Shanghai 45,9667,48315,8472.34107,56017,510
2 Beijing 44,4897,24216,2782.49110,77818,034
3 Zhejiang 32,6585,31611,8782.5482,95113,504
4 Tianjin 28,8324,69417,1262.6275,54012,297
5 Jiangsu 27,1734,42413,3282.9680,43213,094
6 Guangdong 25,6854,18110,3293.1981,93513,338
7 Fujian 23,3313,79810,3332.6962,76010,217
8 Liaoning 22,8203,71510,6142.6360,0179,770
9 Shandong 20,8643,3969,9112.8459,2549,646
10 Inner Mongolia 20,5593,34711,5652.6855,0988,970
Flag of the People's Republic of China.svg  China 20,1673,2837,5952.9759,8969,751
11 Chongqing 18,3522,9887,7912.7249,9178,126
12 Hubei 18,2832,9767,6712.9654,1188,810
13 Hunan 17,6222,8696,5583.1856,0389,123
14 Jilin 17,5202,8528,1662.7247,6547,758
15 Hainan 17,4762,8456,3363.5962,74210,214
16 Heilongjiang 17,4042,8336,3682.6746,4697,565
17 Anhui 16,7962,7345,6043.0851,7328,422
18 Jiangxi 16,7342,7245,6423.4157,0639,289
19 Hebei 16,6472,7106,5093.2053,2708,672
20 Shanxi 16,5382,6925,7083.0650,6068,238
21 Ningxia 15,9072,5906,8103.2050,9028,287
22 Shaanxi 15,8372,5787,6403.0748,6207,915
23 Sichuan 15,7492,5645,7192.6942,3656,897
24 Henan 15,6952,5555,6663.3452,4218,534
25 Guangxi 15,5572,5335,3873.2350,2498,180
26 Xinjiang 15,0972,4586,6113.2048,3107,865
27 Qinghai 14,3742,3406,4523.1945,8537,465
28 Yunnan 13,7722,2424,4333.3045,4487,399
29 Guizhou 12,3712,0144,2973.0938,2266,223
30 Gansu 12,1851,9844,3023.3540,8206,645
31 Tibet 10,7301,7474,7664.0843,7787,127

Related Research Articles

Balance sheet Accounting financial summary

In financial accounting, a balance sheet is a summary of the financial balances of an individual or organization, whether it be a sole proprietorship, a business partnership, a corporation, private limited company or other organization such as government or not-for-profit entity. Assets, liabilities and ownership equity are listed as of a specific date, such as the end of its financial year. A balance sheet is often described as a "snapshot of a company's financial condition". Of the four basic financial statements, the balance sheet is the only statement which applies to a single point in time of a business' calendar year.

Disposable income is total personal income minus current income taxes. In national accounts definitions, personal income minus personal current taxes equals disposable personal income. Subtracting personal outlays yields personal savings, hence the income left after paying away all the taxes is referred to as disposable income.

Government budget balance Difference between revenues and spending

A government budget is a financial statement presenting the government's proposed revenues and spending for a financial year. The government budget balance, also alternatively referred to as general government balance, public budget balance, or public fiscal balance, is the overall difference between government revenues and spending. A positive balance is called a government budget surplus, and a negative balance is a government budget deficit. A budget is prepared for each level of government and takes into account public social security obligations.

Tax brackets are the divisions at which tax rates change in a progressive tax system. Essentially, tax brackets are the cutoff values for taxable income—income past a certain point is taxed at a higher rate.

The national income and product accounts (NIPA) are part of the national accounts of the United States. They are produced by the Bureau of Economic Analysis of the Department of Commerce. They are one of the main sources of data on general economic activity in the United States.

National saving Sum of a countrys private and public saving

In economics, a country's national saving is the sum of private and public saving. It equals a nation's income minus consumption and the government spending.

In the United States income tax system, adjusted gross income (AGI) is an individual's total gross income minus specific deductions. It is used to calculate taxable income, which is AGI minus allowances for personal exemptions and itemized deductions. For most individual tax purposes, AGI is more relevant than gross income.

The median income is the income amount that divides a population into two equal groups, half having an income above that amount, and half having an income below that amount. It may differ from the mean income. The income that occurs most frequently is the income mode. Each of these is a way of understanding income distribution.

The Offer in Compromise program, in the United States, is an Internal Revenue Service (IRS) program under 26 U.S.C. § 7122 which allows qualified individuals with an unpaid tax debt to negotiate a settled amount that is less than the total owed to clear the debt. A taxpayer uses the checklist in the Form 656, Offer in Compromise, package to determine if the taxpayer is eligible for the offer in compromise program. The objective of the OIC program is to accept a compromise when acceptance is in the best interests of both the taxpayer and the government and promotes voluntary compliance with all future payment and filing requirements.

Average propensity to save

In Keynesian economics, the average propensity to save (APS), also known as the savings ratio, is the proportion of income which is saved, usually expressed for household savings as a fraction of total household disposable income.

Household income is a measure of the combined incomes of all people sharing a particular household or place of residence. It includes every form of income, e.g., salaries and wages, retirement income, near cash government transfers like food stamps, and investment gains.

Personal income in the United States

Personal income is an individual's total earnings from wages, investment interest, and other sources. The Bureau of Labor Statistics reported a median personal income of $1010 weekly for all full-time workers in 2021. The U.S. Census Bureau lists the annual real median personal income at $35,977 in 2019 with a base year of 2019 for all people over 15 years old. The U.S. Census Bureau lists the annual real median earnings at $41,535 in 2020 for all workers with earnings and lists the annual median earnings at $56,287 in 2020 for people who worked full-time, year round.

In economics, personal income refers to an individual's total earnings from wages, investment enterprises, and other ventures. It is the sum of all the incomes received by all the individuals or household during a given period. Personal income is that income which is received by the individuals or households in a country during the year from all sources. In general, it refers to all products and money that you receive.

Income in the United Kingdom National income overview

Median household disposable income in the UK was £29,400 in the financial year ending (FYE) 2019, up 1.4% (£400) compared with growth over recent years; median income grew by an average of 0.7% per year between FYE 2017 and FYE 2019, compared with 2.8% between FYE 2013 and FYE 2017.

Taxation in Denmark consists of a comprehensive system of direct and indirect taxes. Ever since the income tax was introduced in Denmark via a fundamental tax reform in 1903, it has been a fundamental pillar in the Danish tax system. Today various personal and corporate income taxes yield around two thirds of the total Danish tax revenues, indirect taxes being responsible for the last third. The state personal income tax is a progressive tax while the municipal income tax is a proportional tax above a certain income level.

Taxation in Norway is levied by the central government, the county municipality and the municipality. In 2012 the total tax revenue was 42.2% of the gross domestic product (GDP). Many direct and indirect taxes exist. The most important taxes – in terms of revenue – are VAT, income tax in the petroleum sector, employers' social security contributions and tax on "ordinary income" for persons. Most direct taxes are collected by the Norwegian Tax Administration and most indirect taxes are collected by the Norwegian Customs and Excise Authorities.

Taxation in South Africa Explanation of tax in South Africa with applicable tables

Taxation may involve payments to a minimum of two different levels of government: central government through SARS or to local government. Prior to 2001 the South African tax system was "source-based", wherein income is taxed in the country where it originates. Since January 2001, the tax system was changed to "residence-based" wherein taxpayers residing in South Africa are taxed on their income irrespective of its source. Non residents are only subject to domestic taxes.

United Kingdom National Accounts – The Blue Book

The annual United Kingdom National Accounts records and describes economic activity in the United Kingdom and as such is used by government, banks, academics and industries to formulate the economic and social policies and monitor the economic progress of the United Kingdom. It also allows international comparisons to be made. The Blue Book is published by the UK Office for National Statistics alongside the United Kingdom Balance of Payments – The Pink Book.