Fuel economy in aircraft

Last updated

Between 1950 and 2018, efficiency per passenger grew from 0.4 to 8.2 RPK per kg of CO2. Aviation Efficiency (RPK per kg CO2).svg
Between 1950 and 2018, efficiency per passenger grew from 0.4 to 8.2 RPK per kg of CO₂.

The fuel economy in aircraft is the measure of the transport energy efficiency of aircraft. Fuel efficiency is increased with better aerodynamics and by reducing weight, and with improved engine brake-specific fuel consumption and propulsive efficiency or thrust-specific fuel consumption. Endurance and range can be maximized with the optimum airspeed, and economy is better at optimum altitudes, usually higher. An airline efficiency depends on its fleet fuel burn, seating density, air cargo and passenger load factor, while operational procedures like maintenance and routing can save fuel.

Contents

Average fuel burn of new aircraft fell 45% from 1968 to 2014, a compounded annual reduction 1.3% with a variable reduction rate. In 2018, CO₂ emissions totalled 747 million tonnes for passenger transport, for 8.5 trillion revenue passenger kilometres (RPK), giving an average of 88 grams CO₂ per RPK [2] (this represents 28 g of fuel per kilometre, or a 3.5 L/100 km (67 mpgUS) fuel consumption per passenger, on average. The worst-performing flights are short trips of from 500 to 1500 kilometres because the fuel used for takeoff is relatively large compared to the amount expended in the cruise segment, and because less fuel-efficient regional jets are typically used on shorter flights. [2]

New technology can reduce engine fuel consumption, like higher pressure and bypass ratios, geared turbofans, open rotors, hybrid electric or fully electric propulsion; and airframe efficiency with retrofits, better materials and systems and advanced aerodynamics.

Flight efficiency theory

The main forces acting on an aircraft Forces2.gif
The main forces acting on an aircraft

A powered aircraft counters its weight through aerodynamic lift and counters its aerodynamic drag with thrust. The aircraft's maximum range is determined by the level of efficiency with which thrust can be applied to overcome the aerodynamic drag.

Aerodynamics

Drag forces by velocity Drag curves for aircraft in flight.svg
Drag forces by velocity

A subfield of fluid dynamics, aerodynamics studies the physics of a body moving through the air. As lift and drag are functions of air speed, their relationships are major determinants of an aircraft's design efficiency.

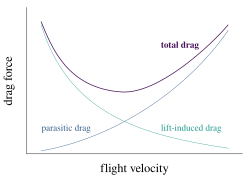
Aircraft efficiency is augmented by maximizing lift-to-drag ratio, which is attained by minimizing parasitic drag and lift-generated induced drag, the two components of aerodynamic drag. As parasitic drag increases and induced drag decreases with speed, there is an optimum speed where the sum of both is minimal; this is the best glide ratio. For powered aircraft, the optimum glide ratio has to be balanced with thrust efficiency.

Parasitic drag is constituted by form drag and skin-friction drag, and grows with the square of the speed in the drag equation. The form drag is minimized by having the smallest frontal area and by streamlining the aircraft for a low drag coefficient, while skin friction is proportional to the body's surface area and can be reduced by maximizing laminar flow.

Induced drag can be reduced by decreasing the size of the airframe, fuel and payload weight, and by increasing the wing aspect ratio or by using wingtip devices at the cost of increased structure weight.[ citation needed ]

Design speed

By increasing efficiency, a lower cruise-speed augments the range and reduces the environmental impact of aviation; however, a higher cruise-speed allows more revenue passenger miles flown per day.

For supersonic flight, drag increases at Mach 1.0 but decreases again after the transition. With a specifically designed aircraft, such as the (discontinued) Aerion AS2, the Mach 1.1 range at 3,700 nmi is 70% of the maximum range of 5,300 nmi at Mach 0.95, but increases to 4,750 nmi at Mach 1.4 for 90% before falling again. [3]

Wingtip devices

Wingtip devices increase the effective wing aspect ratio, lowering lift-induced drag caused by wingtip vortices and improving the lift-to-drag ratio without increasing the wingspan. (Wingspan is limited by the available width in the ICAO Aerodrome Reference Code.) Airbus installed wingtip fences on its planes since the A310-300 in 1985, and Sharklet blended-winglets for the A320 were launched during the November 2009 Dubai Airshow. Their installation adds 200 kilograms (440 lb) but offers a 3.5% fuel burn reduction on flights over 2,800 km (1,500 nmi). [4]

On average, among large commercial jets, Boeing 737-800s benefit the most from winglets. They average a 6.69% increase in efficiency but depending on the route have a fuel savings distribution spanning from 4.6% to 10.5%. Airbus A319s see the most consistent fuel and emissions savings from winglets. Airbus A321s average a 4.8% improvement in fuel consumption, but have the widest swing based on routes and individual aircraft, recognizing anywhere from 0.2% improvement to 10.75%. [5]

Weight

The components of aircraft weight Takeoff weight diagram.svg
The components of aircraft weight

As the weight indirectly generates lift-induced drag, its minimization leads to better aircraft efficiency. For a given payload, a lighter airframe generates a lower drag. Minimizing weight can be achieved through the airframe's configuration, materials science and construction methods. To obtain a longer range, a larger fuel fraction of the maximum takeoff weight is needed, adversely affecting efficiency.[ citation needed ]

The deadweight of the airframe and fuel is non-payload that must be lifted to altitude and kept aloft, contributing to fuel consumption. A reduction in airframe weight enables the use of smaller, lighter engines. The weight savings in both allow for a lighter fuel load for a given range and payload. A rule-of-thumb is that a reduction in fuel consumption of about 0.75% results from each 1% reduction in weight. [6]

The payload fraction of modern twin-aisle aircraft is 18.4% to 20.8% of their maximum take-off weight, while single-aisle airliners are between 24.9% and 27.7%. An aircraft weight can be reduced with light-weight materials such as titanium, carbon fiber and other composite plastics if the expense can be recouped over the aircraft's lifetime. Fuel efficiency gains reduce the fuel carried, reducing the take-off weight for a positive feedback. For example, the Airbus A350 design includes a majority of light-weight composite materials. The Boeing 787 Dreamliner was the first airliner with a mostly composite airframe. [7]

Flight distance

For long-haul flights, the airplane needs to carry additional fuel, leading to higher fuel consumption. Above a certain distance it becomes more fuel-efficient to make a halfway stop to refuel, despite the energy losses in descent and climb. For example, a Boeing 777-300 reaches that point at 3,000 nautical miles (5,600 km). It is more fuel-efficient to make a non-stop flight at less than this distance and to make a stop when covering a greater total distance. [8]

The specific range of a Boeing 777-200 per distance 777-224 fuel burn-range.png
The specific range of a Boeing 777-200 per distance

Very long non-stop passenger flights suffer from the weight penalty of the extra fuel required, which means limiting the number of available seats to compensate. For such flights, the critical fiscal factor is the quantity of fuel burnt per seat-nautical mile. [9] For these reasons, the world's longest commercial flights were cancelled c.2013. An example is Singapore Airlines' former New York to Singapore flight, which could carry only 100 passengers (all business class) on the 10,300-mile (16,600 km) flight. According to an industry analyst, "It [was] pretty much a fuel tanker in the air." [10] Singapore Airlines Flights 21 and 22 were re-launched in 2018 with more seats in an A350-900ULR.

In the late 2000s/early 2010s, rising fuel prices coupled with the Great Recession caused the cancellation of many ultra-long haul, non-stop flights. This included the services provided by Singapore Airlines from Singapore to both Newark and Los Angeles that was ended in late 2013. [11] [12] But as fuel prices have since decreased and more fuel-efficient aircraft have come into service, many ultra-long-haul routes have been reinstated or newly scheduled [13] (see Longest flights).

Propulsive efficiency

Propulsive efficiency comparison for various gas turbine engine configurations Propulsive efficiency for different engine types and Mach numbers.png
Propulsive efficiency comparison for various gas turbine engine configurations

The efficiency can be defined as the amount of energy imparted to the plane per unit of energy in the fuel. The rate at which energy is imparted equals thrust multiplied by airspeed.[ citation needed ]

To get thrust, an aircraft engine is either a shaft engine piston engine or turboprop, with its efficiency inversely proportional to its brake-specific fuel consumption  – coupled with a propeller having its own propulsive efficiency; or a jet engine with its efficiency given by its airspeed divided by the thrust-specific fuel consumption and the specific energy of the fuel. [14] [ need quotation to verify ]

Turboprops have an optimum speed below 460 miles per hour (740 km/h). [15] This is less than jets used by major airlines today, however propeller planes are much more efficient. [16] [ need quotation to verify ] The Bombardier Dash 8 Q400 turboprop is used for this reason as a regional airliner. [17] [18] [ verification needed ]

Jet fuel cost and emissions reduction have renewed interest in the propfan concept for jetliners with an emphasis on engine/airframe efficiency that might come into service beyond the Boeing 787 and Airbus A350XWB. For instance, Airbus has patented aircraft designs with twin rear-mounted counter-rotating propfans. [19] Propfans bridge the gap between turboprops, losing efficiency beyond Mach 0.5-0.6, and high-bypass turbofans, more efficient beyond Mach 0.8. NASA has conducted an Advanced Turboprop Project (ATP), where they researched a variable-pitch propfan that produced less noise and achieved high speeds. [20]

Operations

Refuelling an Airbus A320 with biofuel Refuel EC-KNM Iberia (6218464950).jpg
Refuelling an Airbus A320 with biofuel

In Europe in 2017, the average airline fuel consumption per passenger was 3.4 L/100 km (69 mpgUS), 24% less than in 2005, but as the traffic grew by 60% to 1,643 billion passenger kilometres, CO₂ emissions were up by 16% to 163 million tonnes for 99.8 g/km CO₂ per passenger. [21] In 2018, the US airlines had a fuel consumption of 58 mpgUS (4.06 L/100 km) per revenue passenger for domestic flights, [22] or 32.5 g of fuel per km, generating 102 g CO₂ / RPK of emissions.

Seating classes

In 2013, the World Bank evaluated the business class carbon footprint as 3.04 times higher than economy class in wide-body aircraft, and first class 9.28 times higher, due to premium seating taking more space, lower weight factors, and larger baggage allowances (assuming Load Factors of 80% for Economy Class, 60% for Business Class, and 40% for First Class). [23]

Speed

At constant propulsive efficiency, the maximum range speed is when the ratio between velocity and drag is minimal, [24] while maximum endurance is attained at the best lift-to-drag ratio.

Altitude

Air density decreases with altitude, thus lowering drag, assuming the aircraft maintains a constant equivalent airspeed. However, air pressure and temperature both decrease with altitude, causing the maximum power or thrust of aircraft engines to reduce. To minimize fuel consumption, an aircraft should cruise close to the maximum altitude at which it can generate sufficient lift to maintain its altitude. As the aircraft's weight decreases throughout the flight, due to fuel burn, its optimum cruising altitude increases.

In a piston engine, the decrease in pressure at higher altitudes can be mitigated by the installation of a turbocharger.

Decreasing temperature at higher altitudes increases thermal efficiency.[ citation needed ]

Airlines

A Boeing 787-8 of Norwegian Long Haul Norwegian Long Haul B787-8 LN-LND (29784411145).jpg
A Boeing 787-8 of Norwegian Long Haul

Since early 2006 until 2008, Scandinavian Airlines was flying slower, from 860 to 780 km/h, to save on fuel costs and curb emissions of carbon dioxide. [25]

From 2010 to 2012, the most fuel-efficient US domestic airline was Alaska Airlines, due partly to its regional affiliate Horizon Air flying turboprops. [17] In 2014, MSCI ranked Ryanair as the lowest-emissions-intensity airline in its ACWI index with 75 g CO2-e/revenue passenger kilometre – below Easyjet at 82 g, the average at 123 g and Lufthansa at 132 g – by using high-density 189-seat Boeing 737-800s. In 2015 Ryanair emitted 8.64 Bn t of CO2 for 545,034 sectors flown: 15.85 t per 776 mi (674 nmi; 1,249 km) average sector (or 5.04 t of fuel: 4.04 kg/km) representing 95 kg per 90.6 million passengers (30.4 kg of fuel: 3.04 L/100 km or 76 g CO2/km). [26]

In 2016, over the transpacific routes, the average fuel consumption was 31 pax-km per L (3.23 L/100 km [73 mpgUS] per passenger). The most fuel-efficient were Hainan Airlines and ANA with 36 pax-km/L (2.78 L/100 km [85 mpgUS] per passenger) while Qantas was the least efficient at 22 pax-km/L (4.55 L/100 km [51.7 mpgUS] per passenger). [27] Key drivers for efficiency were the air freight share for 48%, seating density for 24%, aircraft fuel burn for 16% and passenger load factor for 12%. [27] That same year, Cathay Pacific and Cathay Dragon consumed 4,571,000 tonnes of fuel to transport 123,478 million revenue passenger kilometers, or 37 g/RPK, 25% better than in 1998: 4.63 L/100 km (50.8 mpgUS). [28] Again in 2016, the Aeroflot Group fuel consumption is 22.9g/ASK, or 2.86 L/100 km (82 mpgUS) per seat, 3.51 L/100 km (67.0 mpgUS) per passenger at its 81.5% load factor. [29]

Fuel economy in air transport comes from the fuel efficiency of the aircraft + engine model, combined with airline efficiency: seating configuration, passenger load factor and air cargo. Over the transatlantic route, the most-active intercontinental market, the average fuel consumption in 2017 was 34 pax-km per L (2.94 L/100 km [80 mpgUS] per passenger). The most fuel-efficient airline was Norwegian Air Shuttle with 44 pax-km/L (2.27 L/100 km [104 mpgUS] per passenger), thanks to its fuel-efficient Boeing 787-8, a high 85% passenger load factor and a high density of 1.36 seat/m2 due to a low 9% premium seating. On the other side, the least efficient was British Airways at 27 pax-km/L (3.7 L/100 km [64 mpgUS] per passenger), using fuel-inefficient Boeing 747-400s with a low density of 0.75 seat/m2 due to a high 25% premium seating, in spite of a high 82% load factor. [30]

In 2018, CO₂ emissions totalled 918 Mt with passenger transport accounting for 81% or 744 Mt, for 8.2 trillion revenue passenger kilometres: [31] an average fuel economy of 90.7 g/RPK CO₂ - 29 g/km of fuel (3.61 L/100 km [65.2 mpgUS] per passenger)

In 2019, Wizz Air stated a 57 g/RPK CO₂ emissions (equivalent to 18.1 g/km of fuel,2.27 L/100 km [104 mpgUS] per passenger), 40% lower than IAG or Lufthansa (95 g CO₂/RPK - 30 g/km of fuel, 3.8 L/100 km [62 mpgUS] per passenger), due to their business classes, lower-density seating, and flight connections. [32]

In 2021, the highest seating density in its A330neo, with 459 single-class seats, enabled Cebu Pacific to claim the lowest carbon footprint with 1.4 kg (3 lb) of fuel per seat per 100 km, [33] equivalent to 1.75 L/100 km [134 mpgUS] per seat.

Procedures

An Airbus A330-300 of Thai Airways at Tokyo Narita HS-TBG (17127714151).jpg
An Airbus A330-300 of Thai Airways at Tokyo Narita

Continuous Descent Approaches can reduce emissions. [34] Beyond single-engine taxi, electric taxiing could allow taxiing on APU power alone, with the main engines shut down, to lower the fuel burn. [35] [36]

Airbus presented the following measures to save fuel, in its example of an A330 flying 2,500 nautical miles (4,600 km) on a route like Bangkok–Tokyo: direct routing saves 190 kg (420 lb) fuel by flying 40 km (25 mi) less; 600 kg (1,300 lb) more fuel is consumed if flying 600 m (2,000 ft) below optimum altitude without vertical flight profile optimization; cruising Mach 0.01 above the optimum speed consumes 800 kg (1,800 lb) more fuel; 1,000 kg (2,200 lb) more fuel on board consumes 150 kg (330 lb) more fuel while 100 litres (22 imp gal; 26 US gal) of unused potable water consumes 15 kg (33 lb) more fuel. [37]

Operational procedures can save 35 kg (77 lb) fuel for every 10-minute reduction in use of the Auxiliary power unit (APU), 15 kg (33 lb) with a reduced flap approach and 30 kg (66 lb) with reduced thrust reversal on landing. [37] Maintenance can also save fuel: 100 kg (220 lb) more fuel is consumed without an engine wash schedule; 50 kg (110 lb) with a 5 mm (0.20 in) slat rigging gap, 40 kg (88 lb) with a 10 mm (0.39 in) spoiler rigging gap, and 15 kg (33 lb) with a damaged door seal. [37]

Yield management allows the optimization of the load factor, benefiting the fuel efficiency, as is the air traffic management optimization. [38]

By taking advantage of wake updraft like migrating birds (biomimicry), Airbus believes an aircraft can save 5-10% of fuel by flying in formation, 1.5–2 nmi (2.8–3.7 km) behind the preceding one. [39] After A380s tests showing 12% savings, test flights were scheduled for 2020 with two A350s, before transatlantic flight trials with airlines in 2021. [39] Certification for shorter separation is enabled by ADS-B in oceanic airspace, and the only modification required would be flight control systems software. [39] Comfort would not be affected and trials are limited to two aircraft to reduce complexity but the concept could be expanded to include more. [39] Commercial operations could begin in 2025 with airline schedule adjustments, and other manufacturers' aircraft could be included. [39]

While routes are up to 10% longer than necessary, modernized air traffic control systems using ADS-B technology like the FAA NEXTGEN or European SESAR could allow more direct routing, but there is resistance from air traffic controllers. [40]

History

Past

The earliest jet airliner, the de Havilland Comet De Havilland DH-106 Comet 4C, UK - Air Force AN1476165.jpg
The earliest jet airliner, the de Havilland Comet

Modern jet aircraft have twice the fuel efficiency of the earliest jet airliners. [41] Late 1950s piston airliners like the Lockheed L-1049 Super Constellation and DC-7 were 1% to 28% more energy-intensive than 1990s jet airliners which cruise 40 to 80% faster. [42] The early jet airliners were designed at a time when air crew labor costs were higher relative to fuel costs. Despite the high fuel consumption, because fuel was inexpensive in that era the higher speed resulted in favorable economical returns since crew costs and amortization of capital investment in the aircraft could be spread over more seat-miles flown per day. [43] Productivity including speed went from around 150 ASK/MJ*km/h for the 1930s DC-3 to 550 for the L-1049 in the 1950s, and from 200 for the DH-106 Comet 3 to 900 for the 1990s B737-800. [44]

Today's turboprop airliners have better fuel-efficiency than current jet airliners, in part because of their propellers and turbines that are more efficient than those of the 1950s-era piston-powered airliners. [17] In 2012, turboprop airliner usage was correlated with US regional carriers fuel efficiency. [17]

The Airbus A220-300 is the most fuel-efficient, compared with the A319neo and Boeing 737 MAX 7 Bombardier, BD-500 CSeries CS300, C-FFDK - SIAE 2015 (18887460245).jpg
The Airbus A220-300 is the most fuel-efficient, compared with the A319neo and Boeing 737 MAX 7

Jet airliners have become 70% more fuel efficient between 1967 and 2007. [46] Jetliner fuel efficiency improves continuously, 40% of the improvement come from engines and 30% from airframes. [47] Efficiency gains were larger early in the jet age than later, with a 55-67% gain from 1960 to 1980 and a 20-26% gain from 1980 to 2000. [42] Average fuel burn of new aircraft fell 45% from 1968 to 2014, a compounded annual reduction 1.3% with variable reduction rate. [48]

Concorde, a supersonic transport, managed about 17 passenger-miles to the Imperial gallon, which is 16.7 L/100 km per passenger; similar to a business jet, but much worse than a subsonic turbofan aircraft. Airbus states a fuel rate consumption of their A380 at less than 3 L/100 km per passenger (78 passenger-miles per US gallon). [49]

Newer aircraft like the Boeing 787 Dreamliner, Airbus A350 and Bombardier CSeries, are 20% more fuel efficient per passenger kilometre than previous generation aircraft. For the 787, this is achieved through more fuel-efficient engines and lighter composite material airframes, and also through more aerodynamic shapes, winglets, more advanced computer systems for optimising routes and aircraft loading. [50] [ verification needed ] A life-cycle assessment based on the Boeing 787 shows a 20% emission savings compared to conventional aluminium airliners, 14-15% fleet-wide when encompassing a fleet penetration below 100%, while the air travel demand would increase due to lower operating costs. [51]

Lufthansa, when it ordered both, stated the Airbus A350-900 and the Boeing 777X-9 will consume an average of 2.9 L/100 km (81 mpgUS) per passenger. [52] The Airbus A321 featuring Sharklet wingtip devices consume 2.2 L/100 km (110 mpgUS) per person with a 200-seat layout for WOW Air. [53]

Airbus airliners delivered in 2019 had a carbon intensity of 66.6 g of CO2e per passenger-kilometre, improving to 63.5g in 2020. [54]

Example values

The aviation fuel density used is 6.7 lb/USgal or 0.8 kg/L.

Commuter flights

For flights of 300 nmi (560 km):

ModelFirst flightSeatsFuel burnFuel per seat
Antonov An-148 (241 nmi)2004894.23 kg/km (15.0 lb/mi)5.95 L/100 km (39.5 mpgUS) [55]
Antonov An-158 (241 nmi)2010994.34 kg/km (15.4 lb/mi)5.47 L/100 km (43.0 mpgUS) [55]
ATR 42-5001995481.26 kg/km (4.5 lb/mi)3.15 L/100 km (75 mpgUS) [56]
ATR 72-5001997721.67 kg/km (5.9 lb/mi)2.89 L/100 km (81 mpgUS) [56]
ATR 72-5001997701.42 kg/km (5.0 lb/mi)2.53 L/100 km (93 mpgUS) [57]
ATR 72-6002010721.56 kg/km (5.5 lb/mi)2.79 L/100 km (84 mpgUS) [58]
Beechcraft 1900D (226 nm)1982191.00 kg/km (3.56 lb/mi)6.57 L/100 km (35.8 mpgUS) [59]
Bombardier CRJ100 1991502.21 kg/km (7.83 lb/mi)5.50 L/100 km (42.8 mpgUS) [60]
Bombardier CRJ200 1995502.18 kg/km (7.73 lb/mi)5.43 L/100 km (43.3 mpgUS) [60]
Bombardier CRJ700 1999702.95 kg/km (10.47 lb/mi)5.25 L/100 km (44.8 mpgUS) [60]
Bombardier CRJ900 2001883.47 kg/km (12.31 lb/mi)4.91 L/100 km (47.9 mpgUS) [60]
Bombardier Dash 8 Q4001998782.16 kg/km (7.7 lb/mi)3.46 L/100 km (68.0 mpgUS) [61]
Dornier 228 1981190.94 kg/km (3.3 lb/mi)6.22 L/100 km (37.8 mpgUS) [62]
Dornier 328 1991321.22 kg/km (4.3 lb/mi)4.76 L/100 km (49.4 mpgUS) [63]
Embraer Brasilia 1983300.92 kg/km (3.3 lb/mi)3.82 L/100 km (61.6 mpgUS) [64]
Embraer ERJ-135ER (309 nmi)1998371.64 kg/km (5.83 lb/mi)5.52 L/100 km (42.6 mpgUS) [65]
Embraer ERJ-145ER (305 nmi)1995501.76 kg/km (6.23 lb/mi)4.37 L/100 km (53.8 mpgUS) [65]
Saab 340 1983321.1 kg/km (3.9 lb/mi)4.29 L/100 km (54.8 mpgUS) [66]
Saab 2000 1992501.75 kg/km (6.2 lb/mi)4.39 L/100 km (53.6 mpgUS) [67]

Regional flights

For flights of 500–700 nmi (930–1,300 km)

ModelFirst flightSeatsSectorFuel burnFuel efficiency per seat
Airbus A220 1002013115600 nmi (1,100 km)2.8 kg/km (10.1 lb/mi)3.07 L/100 km (76.7 mpgUS) [68]
Airbus A220 3002015140600 nmi (1,100 km)3.10 kg/km (11.01 lb/mi)2.75 L/100 km (85.6 mpgUS) [68]
Airbus A220-100 2013125500 nmi (930 km)2.57 kg/km (9.1 lb/mi)2.57 L/100 km (92 mpgUS) [69]
Airbus A220-300 2015160500 nmi (930 km)2.85 kg/km (10.11 lb/mi)2.23 L/100 km (105 mpgUS) [70]
Airbus A319neo 2015144600 nmi (1,100 km)3.37 kg/km (11.94 lb/mi)2.92 L/100 km (80.6 mpgUS) [68]
Airbus A319neo 2015124660 nmi (1,220 km)2.82 kg/km (10 lb/mi)2.82 L/100 km (83.5 mpgUS) [71]
Airbus A320neo 2015154660 nmi (1,220 km)2.79 kg/km (9.9 lb/mi)2.25 L/100 km (104.7 mpgUS) [71]
Airbus A321neo 2015192660 nmi (1,220 km)3.30 kg/km (11.7 lb/mi)2.19 L/100 km (107.4 mpgUS) [71]
Antonov An-148 200489684 nmi (1,267 km)2.89 kg/km (10.3 lb/mi)4.06 L/100 km (57.9 mpgUS) [55]
Antonov An-158 201099684 nmi (1,267 km)3 kg/km (11 lb/mi)3.79 L/100 km (62.1 mpgUS) [55]
ATR 42-600 201050500 nmi (930 km)1.30 kg/km (4.6 lb/mi)3.27 L/100 km (72 mpgUS) [72]
ATR 72-600 201072500 nmi (930 km)1.41 kg/km (5 lb/mi)2.46 L/100 km (96 mpgUS) [73]
Boeing 737-3001984126507 nmi (939 km)3.49 kg/km (12.4 lb/mi)3.46 L/100 km (68 mpgUS) [74]
Boeing 737-6001998110500 nmi (930 km)3.16 kg/km (11.2 lb/mi)3.59 L/100 km (65.5 mpgUS) [75]
Boeing 737-7001997126500 nmi (930 km)3.21 kg/km (11.4 lb/mi)3.19 L/100 km (74 mpgUS) [75]
Boeing 737 MAX 72017128660 nmi (1,220 km)2.85 kg/km (10.1 lb/mi)2.77 L/100 km (84.8 mpgUS) [71]
Boeing 737 MAX 72017144600 nmi (1,100 km)3.39 kg/km (12.01 lb/mi)2.93 L/100 km (80.2 mpgUS) [68]
Boeing 737-8001997162500 nmi (930 km)3.59 kg/km (12.7 lb/mi)2.77 L/100 km (85 mpgUS) [75]
Boeing 737 MAX 82017166660 nmi (1,220 km)3.04 kg/km (10.8 lb/mi)2.28 L/100 km (103.2 mpgUS) [71]
Boeing 737-900ER2006180500 nmi (930 km)3.83 kg/km (13.6 lb/mi)2.66 L/100 km (88 mpgUS) [75]
Boeing 737 MAX 92017180660 nmi (1,220 km)3.30 kg/km (11.7 lb/mi)2.28 L/100 km (103 mpgUS) [71]
Boeing 757-2001982200500 nmi (930 km)4.68 kg/km (16.61 lb/mi)2.91 L/100 km (80.7 mpgUS) [76]
Boeing 757-3001998243500 nmi (930 km)5.19 kg/km (18.41 lb/mi)2.66 L/100 km (88.4 mpgUS) [76]
Bombardier CRJ100 199150577 nmi (1,069 km)1.87 kg/km (6.65 lb/mi)4.68 L/100 km (50.3 mpgUS) [60]
Bombardier CRJ200 199550580 nmi (1,070 km)1.80 kg/km (6.39 lb/mi)4.49 L/100 km (52.4 mpgUS) [60]
Bombardier CRJ700 199970574 nmi (1,063 km)2.45 kg/km (8.68 lb/mi)4.36 L/100 km (54 mpgUS) [60]
Bombardier CRJ900 200188573 nmi (1,061 km)2.78 kg/km (9.88 lb/mi)3.94 L/100 km (59.7 mpgUS) [60]
Bombardier CRJ1000 2009100500 nmi (930 km)2.66 kg/km (9.4 lb/mi)3.33 L/100 km (71 mpgUS) [77]
Bombardier Dash 8 Q400199874500 nmi (930 km)2.31 kg/km (8.2 lb/mi)3.9 L/100 km (60 mpgUS) [78]
Bombardier Dash 8 Q400199874600 nmi (1,100 km)1.83 kg/km (6.5 lb/mi)3.09 L/100 km (76 mpgUS) [79]
Dornier 328 199131600 nmi (1,100 km)1.08 kg/km (3.8 lb/mi)4.35 L/100 km (54.1 mpgUS) [80]
Embraer E-Jet E2-175202088600 nmi (1,100 km)2.44 kg/km (8.64 lb/mi)3.44 L/100 km (68.3 mpgUS) [68]
Embraer E-Jet E2-1902018106500 nmi (930 km)2.48 kg/km (8.8 lb/mi)2.93 L/100 km (80 mpgUS) [81]
Embraer E-Jet E2-1902018106600 nmi (1,100 km)2.83 kg/km (10.04 lb/mi)3.32 L/100 km (70.8 mpgUS) [68]
Embraer E-Jet E2-1952019132500 nmi (930 km)2.62 kg/km (9.3 lb/mi)2.5 L/100 km (94 mpgUS) [82]
Embraer E-Jet E2-1952019132600 nmi (1,100 km)3.07 kg/km (10.91 lb/mi)2.90 L/100 km (81 mpgUS) [68]
Embraer E-Jet-170200280606 nmi (1,122 km)2.6 kg/km (9.3 lb/mi)4.08 L/100 km (57.7 mpgUS) [83]
Embraer E-Jet-175200588605 nmi (1,120 km)2.80 kg/km (9.95 lb/mi)3.97 L/100 km (59.3 mpgUS) [83]
Embraer E-Jet-1902004114607 nmi (1,124 km)3.24 kg/km (11.48 lb/mi)3.54 L/100 km (66.5 mpgUS) [83]
Embraer E-Jet-1952004122607 nmi (1,124 km)3.21 kg/km (11.38 lb/mi)3.28 L/100 km (71.8 mpgUS) [83]
Embraer ERJ-135ER199837596 nmi (1,104 km)1.44 kg/km (5.12 lb/mi)4.86 L/100 km (48.4 mpgUS) [65]
Embraer ERJ-145ER199650598 nmi (1,107 km)1.55 kg/km (5.49 lb/mi)3.86 L/100 km (61 mpgUS) [65]
Pilatus PC-12 19919500 nmi (930 km)0.41 kg/km (1.5 lb/mi)5.66 L/100 km (41.6 mpgUS) [84]
Saab 340 198331500 nmi (930 km)0.95 kg/km (3.4 lb/mi)3.83 L/100 km (61.4 mpgUS) [66]
Saab 2000 199250500 nmi (930 km)1.54 kg/km (5.5 lb/mi)3.85 L/100 km (61.1 mpgUS) [67]
Sukhoi SSJ100 200898500 nmi (930 km)2.81 kg/km (10.0 lb/mi)3.59 L/100 km (65.5 mpgUS) [85]

Short-haul flights

For flights of 1,000 nmi (1,900 km):

ModelFirst flightSeatsFuel BurnFuel efficiency per seat
Airbus A220-100 20131252.28 kg/km (8.1 lb/mi)2.28 L/100 km (103 mpgUS) [69]
Airbus A220-300 20151352.30 kg/km (8.17 lb/mi)2.13 L/100 km (110 mpgUS) [45]
Airbus A220-300 20151502.42 kg/km (8.6 lb/mi)2.02 L/100 km (116 mpgUS) [86]
Airbus A220-300 20151602.56 kg/km (9.08 lb/mi)2.00 L/100 km (118 mpgUS) [70]
Airbus A319 19951242.93 kg/km (10.4 lb/mi)2.95 L/100 km (80 mpgUS) [87]
Airbus A319neo 20151362.4 kg/km (8.6 lb/mi)2.22 L/100 km (106 mpgUS) [45]
Airbus A320 19871503.13 kg/km (11.1 lb/mi)2.61 L/100 km (90 mpgUS) [87]
Airbus A320neo 20161802.79 kg/km (9.9 lb/mi)1.94 L/100 km (121 mpgUS) [88]
Airbus A321-20019961803.61 kg/km (12.8 lb/mi)2.50 L/100 km (94 mpgUS) [87]
Airbus A321neo 20172203.47 kg/km (12.3 lb/mi)1.98 L/100 km (119 mpgUS) [89]
Airbus A330-20019972935.6 kg/km (19.8 lb/mi)2.37 L/100 km (99 mpgUS) [87]
Antonov An-148 (1190 nmi)2004892.75 kg/km (9.8 lb/mi)3.86 L/100 km (60.9 mpgUS) [55]
Antonov An-158 (1190 nmi)2010992.83 kg/km (10.0 lb/mi)3.57 L/100 km (65.9 mpgUS) [55]
Boeing 737-60019981102.77 kg/km (9.8 lb/mi)3.15 L/100 km (75 mpgUS) [75]
Boeing 737-70019971262.82 kg/km (10.0 lb/mi)2.79 L/100 km (84 mpgUS) [75]
Boeing 737-70019971282.8 kg/km (9.9 lb/mi)2.71 L/100 km (87 mpgUS) [87]
Boeing 737 MAX-720171402.51 kg/km (8.91 lb/mi)1.94 L/100 km (121 mpgUS) [45]
Boeing 737-80019971623.17 kg/km (11.2 lb/mi)2.44 L/100 km (96 mpgUS) [75]
Boeing 737-80019971603.45 kg/km (12.23 lb/mi)2.68 L/100 km (88 mpgUS) [87]
Boeing 737-800W19971623.18 kg/km (11.3 lb/mi)2.45 L/100 km (96 mpgUS) [90]
Boeing 737 MAX-820171622.71 kg/km (9.6 lb/mi)2.04 L/100 km (115 mpgUS) [90]
Boeing 737-900ER20061803.42 kg/km (12.1 lb/mi)2.38 L/100 km (99 mpgUS) [75]
Boeing 737-900ERW20061803.42 kg/km (12.1 lb/mi)2.37 L/100 km (99 mpgUS) [90]
Boeing 737 MAX-920171802.91 kg/km (10.3 lb/mi)2.02 L/100 km (116 mpgUS) [90]
Boeing 757-20019821904.60 kg/km (16.33 lb/mi)3.02 L/100 km (78 mpgUS) [87]
Boeing 757-20019822004.16 kg/km (14.76 lb/mi)2.59 L/100 km (90.8 mpgUS) [76]
Boeing 757-30019982434.68 kg/km (16.62 lb/mi)2.40 L/100 km (98 mpgUS) [76]
Boeing 787-8 20092485.50 kg/km (19.5 lb/mi)2.77 L/100 km (85 mpgUS) [91]
Boeing 787-9 20132965.67 kg/km (20.1 lb/mi)2.39 L/100 km (98 mpgUS) [92]
Boeing 787-10 20173366.09 kg/km (21.6 lb/mi)2.27 L/100 km (104 mpgUS) [93]
Quest Kodiak 200490.71 kg/km (2.52 lb/mi)6.28 L/100 km (37.5 mpgUS) [94]

Medium-haul flights

For flights around 2,000–3,000 nmi (3,700–5,600 km), transcontinental (e.g. Washington DullesSeattle-Tacoma is 2,000 nmi) to short transatlantic flights (e.g. New York JFKLondon-Heathrow is 3,000 nmi). [95]

ModelFirst flightSeatsSectorFuel burnFuel per seat
Airbus A220-300 20151502,000 nmi (3,700 km)2.42 kg/km (8.59 lb/mi)2.02 L/100 km (116 mpgUS) [70]
Airbus A320 19871502,151 nmi (3,984 km)2.91 kg/km (10.3 lb/mi)2.43 L/100 km (97 mpgUS) [96]
Airbus A321LR 20161543,400 nmi (6,300 km)2.99 kg/km (10.6 lb/mi)2.43 L/100 km (97 mpgUS) [97]
Airbus A330-20019972413,000 nmi (5,600 km)6 kg/km (21 lb/mi)3.11 L/100 km (76 mpgUS) [98]
Airbus A330-30019922623,000 nmi (5,600 km)6.25 kg/km (22.2 lb/mi)2.98 L/100 km (79 mpgUS) [98]
Airbus A330-90020163103,350 nmi (6,200 km)6 kg/km (21 lb/mi)2.42 L/100 km (97 mpgUS) [99]
Airbus A340-30019922623,000 nmi (5,600 km)6.81 kg/km (24.2 lb/mi)3.25 L/100 km (72 mpgUS) [98]
Airbus A380 20055442,000 nmi (3,700 km)13.6 kg/km (48.4 lb/mi)3.14 L/100 km (75 mpgUS) [100]
Boeing 737 MAX-820171683,400 nmi (6,300 km)2.86 kg/km (10.1 lb/mi)2.13 L/100 km (110 mpgUS) [101]
Boeing 737 MAX-920171443,400 nmi (6,300 km)2.91 kg/km (10.3 lb/mi)2.53 L/100 km (93 mpgUS) [97]
Boeing 747-400 19884162,151 nmi (3,984 km)10.77 kg/km (38.2 lb/mi)3.24 L/100 km (73 mpgUS) [96]
Boeing 747-8 20114673,000 nmi (5,600 km)9.9 kg/km (35 lb/mi)2.65 L/100 km (89 mpgUS) [102]
Boeing 757-200W19811583,400 nmi (6,300 km)3.79 kg/km (13.4 lb/mi)3.00 L/100 km (78 mpgUS) [97]
Boeing 767-200ER19841813,000 nmi (5,600 km)4.83 kg/km (17.1 lb/mi)3.34 L/100 km (70 mpgUS) [103]
Boeing 767-200ER19841933,400 nmi (6,300 km)5.01 kg/km (17.8 lb/mi)3.25 L/100 km (72 mpgUS) [97]
Boeing 767-200ER19842243,000 nmi (5,600 km)4.93 kg/km (17.5 lb/mi)2.75 L/100 km (86 mpgUS) [103]
Boeing 767-300ER19882182,151 nmi (3,984 km)5.38 kg/km (19.1 lb/mi)3.09 L/100 km (76 mpgUS) [96]
Boeing 767-300ER19882183,000 nmi (5,600 km)5.39 kg/km (19.1 lb/mi)3.09 L/100 km (76 mpgUS) [103]
Boeing 767-300ER19882693,000 nmi (5,600 km)5.51 kg/km (19.5 lb/mi)2.56 L/100 km (92 mpgUS) [103]
Boeing 767-400ER19992453,000 nmi (5,600 km)5.78 kg/km (20.5 lb/mi)2.95 L/100 km (80 mpgUS) [103]
Boeing 767-400ER19993043,000 nmi (5,600 km)5.93 kg/km (21.0 lb/mi)2.44 L/100 km (96 mpgUS) [103]
Boeing 767-400ER19993043,265 nmi (6,047 km)5.92 kg/km (21 lb/mi)2.43 L/100 km (96.9 mpgUS) [74]
Boeing 777-20019943053,000 nmi (5,600 km)6.83 kg/km (24.2 lb/mi)2.80 L/100 km (84 mpgUS) [104]
Boeing 777-200ER19963013,000 nmi (5,600 km)6.96 kg/km (24.7 lb/mi)2.89 L/100 km (81 mpgUS) [98]
Boeing 777-30019973683,000 nmi (5,600 km)7.88 kg/km (28.0 lb/mi)2.68 L/100 km (88 mpgUS) [104]
Boeing 787-820092913,400 nmi (6,300 km)5.26 kg/km (18.7 lb/mi)2.26 L/100 km (104 mpgUS) [101]
Boeing 787-820092383,400 nmi (6,300 km)5.11 kg/km (18.1 lb/mi)2.68 L/100 km (88 mpgUS) [97]
Boeing 787-920133043,350 nmi (6,200 km)5.77 kg/km (20.5 lb/mi)2.37 L/100 km (99 mpgUS) [99]
Irkut MC-21-30020171631,750 nmi (3,240 km)3.04 kg/km (10.8 lb/mi)2.33 L/100 km (101 mpgUS) [105]

Long-haul flights

For flights around 5,000 to 7,000 nmi (9,300 to 13,000 km), including transpacific flights (e.g. Hong KongSan Francisco International is 6,000 nmi). [106]

ModelFirst flightSeatsSectorFuel burnFuel per seat
Airbus A330-20019972416,000 nmi (11,000 km)6.4 kg/km (23 lb/mi)3.32 L/100 km (71 mpgUS) [98]
Airbus A330-20019972485,549 nmi (10,277 km)6.55 kg/km (23.2 lb/mi)3.3 L/100 km (71 mpgUS) [107]
Airbus A330-30019922745,548 nmi (10,275 km)6.81 kg/km (24.2 lb/mi)3.11 L/100 km (76 mpgUS) [107]
Airbus A330-80020172484,650 nmi (8,610 km)5.45 kg/km (19.3 lb/mi)2.75 L/100 km (86 mpgUS) [108]
Airbus A330-90020173004,650 nmi (8,610 km)5.94 kg/km (21.1 lb/mi)2.48 L/100 km (95 mpgUS) [108]
Airbus A340-30019922626,000 nmi (11,000 km)7.32 kg/km (26.0 lb/mi)3.49 L/100 km (67.4 mpgUS) [98]
Airbus A350-90020133154,972 nmi (9,208 km)6.03 kg/km (21.4 lb/mi)2.39 L/100 km (98 mpgUS) [99]
Airbus A350-90020133185,534 nmi (10,249 km)6.52 kg/km (23.1 lb/mi)2.56 L/100 km (92 mpgUS) [107]
Airbus A350-90020133156,542 nmi (12,116 km)7.07 kg/km (25.1 lb/mi)2.81 L/100 km (84 mpgUS) [109]
Airbus A350-100020163275,531 nmi (10,243 km)7.46 kg/km (26.5 lb/mi)2.85 L/100 km (83 mpgUS) [107]
Airbus A350-100020163675,531 nmi (10,243 km)7.58 kg/km (26.9 lb/mi)2.58 L/100 km (91 mpgUS) [107]
Airbus A380 20055257,200 nmi (13,300 km)13.78 kg/km (48.9 lb/mi)3.27 L/100 km (72 mpgUS) [110]
Airbus A380 20055446,000 nmi (11,000 km)13.78 kg/km (48.9 lb/mi)3.16 L/100 km (74 mpgUS) [111]
Boeing 747-400 19884166,000 nmi (11,000 km)11.11 kg/km (39.4 lb/mi)3.34 L/100 km (70 mpgUS) [112]
Boeing 747-400 19883935,503 nmi (10,192 km)11.82 kg/km (41.9 lb/mi)3.76 L/100 km (62.6 mpgUS) [107]
Boeing 747-400 19884875,479 nmi (10,147 km)12.31 kg/km (43.7 lb/mi)3.16 L/100 km (74 mpgUS) [107]
Boeing 747-8 20114676,000 nmi (11,000 km)10.54 kg/km (37.4 lb/mi)2.82 L/100 km (83 mpgUS) [102]
Boeing 747-8 20114057,200 nmi (13,300 km)10.9 kg/km (39 lb/mi)3.35 L/100 km (70 mpgUS) [110]
Boeing 777-200ER19963045,535 nmi (10,251 km)7.57 kg/km (26.9 lb/mi)3.11 L/100 km (76 mpgUS) [107]
Boeing 777-200ER19963016,000 nmi (11,000 km)7.42 kg/km (26.3 lb/mi)3.08 L/100 km (76 mpgUS) [98]
Boeing 777-200ER19963016,000 nmi (11,000 km)7.44 kg/km (26.4 lb/mi)3.09 L/100 km (76 mpgUS) [104]
Boeing 777-200LR20052914,972 nmi (9,208 km)7.57 kg/km (26.9 lb/mi)3.25 L/100 km (72 mpgUS) [99]
Boeing 777-300ER20033825,507 nmi (10,199 km)8.86 kg/km (31.4 lb/mi)2.9 L/100 km (81 mpgUS) [107]
Boeing 777-300ER20033656,000 nmi (11,000 km)8.49 kg/km (30.1 lb/mi)2.91 L/100 km (81 mpgUS) [104]
Boeing 777-300ER20033447,200 nmi (13,300 km)8.58 kg/km (30.4 lb/mi)3.11 L/100 km (76 mpgUS) [110]
Boeing 777-9X 20203957,200 nmi (13,300 km)7.69 kg/km (27.3 lb/mi)2.42 L/100 km (97 mpgUS) [110]
Boeing 787-820112434,650 nmi (8,610 km)5.38 kg/km (19.1 lb/mi)2.77 L/100 km (85 mpgUS) [108]
Boeing 787-8 GEnx20112205,537 nmi (10,255 km)5.3 kg/km (19 lb/mi)3.01 L/100 km (78 mpgUS) [107]
Boeing 787-8 Trent20112205,537 nmi (10,255 km)5.51 kg/km (19.5 lb/mi)3.13 L/100 km (75 mpgUS) [107]
Boeing 787-9 GEnx20132944,650 nmi (8,610 km)5.85 kg/km (20.8 lb/mi)2.49 L/100 km (94 mpgUS) [108]
Boeing 787-920133044,972 nmi (9,208 km)5.63 kg/km (20.0 lb/mi)2.31 L/100 km (102 mpgUS) [99]
Boeing 787-9 GEnx20132665,534 nmi (10,249 km)5.62 kg/km (19.9 lb/mi)2.64 L/100 km (89 mpgUS) [107]
Boeing 787-920132916,542 nmi (12,116 km)7.18 kg/km (25.5 lb/mi)3.08 L/100 km (76 mpgUS) [109]
Boeing 787-10 GEnx20173375,529 nmi (10,240 km)6.12 kg/km (21.7 lb/mi)2.27 L/100 km (104 mpgUS) [107]
Boeing 787-10 Trent20173375,529 nmi (10,240 km)6.24 kg/km (22.1 lb/mi)2.31 L/100 km (102 mpgUS) [107]

For a comparison with ground transportation - much slower and with shorter range than air travel - a Volvo bus 9700 averages 0.41 L/100 km (570 mpgUS) per seat for 63 seats. [113] In highway travel an average auto has the potential for 1.61 L/100 km (146 mpgUS) [114] per seat (assuming 4 seats) and for a 5-seat 2014 Toyota Prius, 0.98 L/100 km (240 mpgUS). [115] While this shows the capabilities of the vehicles, the load factors (percentage of seats occupied) may differ between personal use (commonly just the driver in the car) and societal averages for long-distance auto use, and among those of particular airlines.

General aviation

For private aircraft in general aviation, current FAI Aeroplane Efficiency records are : [116]

A four-seat Dyn'Aéro MCR4S powered by a Rotax 914 consumes 8.3 L/100 km at 264 km/h [117] (2.1 L/100 km per seat).

Business aircraft

Hourly Fuel Burn for Private Aircraft [118]
TypeAircraftUS galLlbkg
Turboprops Pilatus PC12 [lower-alpha 1] 66250442200
Cessna Grand Caravan EX [lower-alpha 2] 58220390177
King Air 350 [lower-alpha 2] 100379670304
Light Jets Cessna Citation M2 137–104519–394918–697416–316
Embraer Phenom 100 [lower-alpha 3] 109–77413–291730–516331–234
Cessna Citation CJ3+ [lower-alpha 4] 124–116469–439830–780376–354
Embraer Phenom 300 [lower-alpha 3] 166–115628–4351,112–770504–349
Learjet 70/75 [lower-alpha 3] 239–179905–6781,600–1,200726–544
Mid-Size Jets Bombardier Challenger 300 [lower-alpha 1] 2661,0071,782808
Gulfstream G200 [lower-alpha 1] 2338821,561708
Hawker 900XP [lower-alpha 1] 2579731,722781
Cessna Citation X+ [lower-alpha 1] 3361,2722,2511,021
Dassault Falcon 7X [lower-alpha 1] 3181,2042,130966
Long-Range Jets Gulfstream G550 [lower-alpha 3] 672–4472,544–1,6924,500–3,0002,041–1,361
Bombardier Global 6000 512–4861,938–1,8403,430–3,2561,556–1,477
Airbus ACJ319 [lower-alpha 1] 6402,4234,2881,945
  1. 1 2 3 4 5 6 7 Average
  2. 1 2 Cruise
  3. 1 2 3 4 1st hour-2nd hour
  4. Average-Cruise

Future

Boeing/NASA's X-48B blended wing body demonstrator X-48B from above.jpg
Boeing/NASA's X-48B blended wing body demonstrator
Boeing's blended wing body concept Boeing advanced blended wing body concept 2011 (cropped).jpg
Boeing's blended wing body concept
NASA / Aurora Flight Sciences D8 airliner concept MIT and Aurora D8 wide body passenger aircraft concept 2010.jpg
NASA / Aurora Flight Sciences D8 airliner concept
Boeing Volt truss-braced wing concept Boeing SUGAR Volt concept aircraft 2010.jpg
Boeing Volt truss-braced wing concept

NASA and Boeing flight-tested a 500 lb (230 kg) blended wing body (BWB) X-48B demonstrator from August 2012 to April 2013. This design provides greater fuel efficiency, since the whole craft produces lift, not just the wings. [119] The BWB concept offers advantages in structural, aerodynamic and operating efficiencies over today's more-conventional fuselage-and-wing designs. These features translate into greater range, fuel economy, reliability and life-cycle savings, as well as lower manufacturing costs. [120] [121] NASA has created a cruise efficient STOL (CESTOL) concept.

Fraunhofer Institute for Manufacturing Engineering and Applied Materials Research (IFAM) have researched a sharkskin-imitating paint that would reduce drag through a riblet effect. [122] Aviation is a major potential application for new technologies such as aluminium metal foam and nanotechnology.

The International Air Transport Association (IATA) technology roadmap envisions improvements in aircraft configuration and aerodynamics. It projects the following reductions in engine fuel consumption, compared to baseline aircraft in service in 2015: [123]

Moreover, it projects the following gains for aircraft design technologies: [123]

Today's tube-and-wing configuration could remain in use until the 2030s due to drag reductions from active flutter suppression for slender flexible-wings and natural and hybrid laminar flow. [124] Large, ultra high bypass engines will need upswept gull wings or overwing nacelles as Pratt & Whitney continue to develop its geared turbofan to save a projected 10–15% of fuel costs by the mid-2020s. [124] NASA indicates this configuration could gain up to 45% with advanced aerodynamics, structures and geared turbofans, but longer term suggests savings of up to 50% by 2025 and 60% by 2030 with new ultra-efficient configurations and propulsion architectures: hybrid wing body, truss-braced wing, lifting body designs, embedded engines, and boundary-layer ingestion. [124] By 2030 hybrid-electric architectures may be ready for 100 seaters and distributed propulsion with tighter integration of airframe may enable further efficiency and emissions improvements. [124]

Research projects such as Boeing's ecoDemonstrator program have sought to identify ways of improving the fuel economy of commercial aircraft operations. The U.S. government has encouraged such research through grant programs, including the FAA's Continuous Lower Energy, Emissions and Noise (CLEEN) program, and NASA's Environmentally Responsible Aviation (ERA) Project.[ citation needed ]

Multiple concepts are projected to reduce fuel consumption: [125]

Climate change

The growth of air travel outpaces its fuel-economy improvements and corresponding CO2 emissions, compromising climate sustainability. Although low-cost carriers' higher seat-density increases fuel economy and lowers greenhouse gas emissions per-passenger-kilometer, the lower airfares cause a rebound effect of more flights and larger overall emissions. The tourism industry could shift emphasis to emissions eco-efficiency in CO2 per unit of revenue or profit instead of fuel economy, favoring shorter trips and ground transportation over flying long journeys to reduce greenhouse gas emissions. [128]

See also

Related Research Articles

<span class="mw-page-title-main">Boeing 777</span> Wide-body, long-range, twin-engine jet airliner family

The Boeing 777, commonly referred to as the Triple Seven, is an American long-range wide-body airliner developed and manufactured by Boeing Commercial Airplanes. The 777 is the world's largest twinjet and the most-built wide-body airliner. The jetliner was designed to bridge the gap between Boeing's other wide body airplanes, the twin-engined 767 and quad-engined 747, and to replace aging DC-10 and L-1011 trijets. Developed in consultation with eight major airlines, the 777 program was launched in October 1990, with an order from United Airlines. The prototype was rolled out in April 1994, and first flew in June. The 777 entered service with the launch operator United Airlines in June 1995. Longer-range variants were launched in 2000, and first delivered in 2004.

<span class="mw-page-title-main">Boeing 737</span> Single-aisle airliner family by Boeing

The Boeing 737 is a narrow-body aircraft produced by Boeing at its Renton factory in Washington. Developed to supplement the Boeing 727 on short and thin routes, the twinjet retained the 707 fuselage width and six abreast seating but with two underwing turbofans instead of four. Envisioned in 1964, the initial 737-100 made its first flight in April 1967 and entered service in February 1968 with Lufthansa. The lengthened 737-200 entered service in April 1968, and evolved through four generations, offering several variants for 85 to 215 passengers.

<span class="mw-page-title-main">Boeing 757</span> Airliner family by Boeing

The Boeing 757 is an American narrow-body airliner designed and built by Boeing Commercial Airplanes. The then-named 7N7, a twinjet successor for the trijet 727, received its first orders in August 1978. The prototype completed its maiden flight on February 19, 1982, and it was FAA certified on December 21, 1982. Eastern Air Lines placed the initial 757-200 variant in commercial service on January 1, 1983. A package freighter (PF) variant entered service in September 1987 and a combi model in September 1988. The stretched 757-300 was launched in September 1996 and began service in March 1999. After 1,050 had been built for 54 customers, production ended in October 2004, while Boeing offered the largest 737 NG variants as a successor.

<span class="mw-page-title-main">Airbus A320 family</span> European airliner family

The Airbus A320 family is a series of narrow-body airliners developed and produced by Airbus. The A320 was launched in March 1984, first flew on 22 February 1987, and was introduced in April 1988 by Air France. The first member of the family was followed by the longer A321, the shorter A319, and the even shorter A318 . Final assembly takes place in Toulouse in France; Hamburg in Germany; Tianjin in China since 2009; and Mobile, Alabama in the United States since April 2016.

<span class="mw-page-title-main">Airbus A340</span> Type of aircraft

The Airbus A340 is a long-range, wide-body passenger airliner that was developed and produced by Airbus. In the mid-1970s, Airbus conceived several derivatives of the A300, its first airliner, and developed the A340 quadjet in parallel with the A330 twinjet. In June 1987, Airbus launched both designs with their first orders and the A340-300 took its maiden flight on 25 October 1991. It was certified along with the A340-200 on 22 December 1992 and both versions entered service in March 1993 with launch customers Lufthansa and Air France. The larger A340-500/600 were launched on 8 December 1997; the A340-600 flew for the first time on 23 April 2001 and entered service on 1 August 2002.

<span class="mw-page-title-main">Airbus A321</span> Airliner, stretched model of the A320 family

The Airbus A321 is a member of the Airbus A320 family of short to medium range, narrow-body, commercial passenger twin engine jet airliners; it carries 185 to 236 passengers. It has a stretched fuselage which was the first derivative of the baseline A320 and entered service in 1994, about six years after the original A320. The aircraft shares a common type rating with all other Airbus A320-family variants, allowing previous A320-family pilots to fly the aircraft without the need for further training.

<span class="mw-page-title-main">Airbus A330</span> Wide-body twin-engine jet airliner

The Airbus A330 is a wide-body aircraft developed and produced by Airbus. Airbus conceived several derivatives of the A300, its first airliner from the mid-1970s. Then the company began development on the A330 twinjet in parallel with the A340 quadjet and launched both designs with their first orders in June 1987. The A330-300, the first variant, took its maiden flight in November 1992 and entered service with Air Inter in January 1994. The slightly shorter A330-200 variant followed in 1998.

<span class="mw-page-title-main">Wide-body aircraft</span> Airliner with two aisles

A wide-body aircraft, also known as a twin-aisle aircraft and in the largest cases as a jumbo jet, is an airliner with a fuselage wide enough to accommodate two passenger aisles with seven or more seats abreast. The typical fuselage diameter is 5 to 6 m. In the typical wide-body economy cabin, passengers are seated seven to ten abreast, allowing a total capacity of 200 to 850 passengers. Seven-abreast aircraft typically seat 160 to 260 passengers, eight-abreast 250 to 380, nine- and ten-abreast 350 to 480. The largest wide-body aircraft are over 6 m (20 ft) wide, and can accommodate up to eleven passengers abreast in high-density configurations.

<span class="mw-page-title-main">Supersonic transport</span> Airliner faster than the speed of sound

A supersonic transport (SST) or a supersonic airliner is a civilian supersonic aircraft designed to transport passengers at speeds greater than the speed of sound. To date, the only SSTs to see regular service have been Concorde and the Tupolev Tu-144. The last passenger flight of the Tu-144 was in June 1978 and it was last flown in 1999 by NASA. Concorde's last commercial flight was in October 2003, with a November 26, 2003 ferry flight being its last airborne operation. Following the permanent cessation of flying by Concorde, there are no remaining SSTs in commercial service. Several companies have each proposed a supersonic business jet, which may bring supersonic transport back again.

<span class="mw-page-title-main">Jet airliner</span> Passenger aircraft powered by jet engines

A jet airliner or jetliner is an airliner powered by jet engines. Airliners usually have two or four jet engines; three-engined designs were popular in the 1970s but are less common today. Airliners are commonly classified as either the large wide-body aircraft, medium narrow-body aircraft and smaller regional jet.

<span class="mw-page-title-main">Cruise (aeronautics)</span> Level flight after an aircraft climbs to a set altitude and before it begins to descend

Cruise is the phase of aircraft flight that starts when the aircraft levels off after a climb, until it begins to descend for landing. Cruising usually comprises the majority of a flight, and may include changes in heading, airspeed, and altitude.

<span class="mw-page-title-main">McDonnell Douglas MD-11</span> Wide body airliners developed from the DC-10

The McDonnell Douglas MD-11 is an American tri-jet wide-body airliner manufactured by American manufacturer McDonnell Douglas (MDC) and later by Boeing. Following DC-10 development studies, the MD-11 program was launched on December 30, 1986. Assembly of the first prototype began on March 9, 1988. Its maiden flight occurred on January 10, 1990, and it achieved Federal Aviation Administration (FAA) certification on November 8. The first delivery was to Finnair on December 7 and it entered service on December 20, 1990.

<span class="mw-page-title-main">Dassault Mercure</span> French twin engine narrow-body jet airliner built 1971–1975

The Dassault Mercure is a twin-engined narrow-body jet-powered airliner developed and manufactured by French aircraft firm Dassault Aviation. According to Dassault, it was the first large-scale European cooperative civil aeronautics programme.

<span class="mw-page-title-main">Airbus A220</span> Narrow-body jet airliner family

The Airbus A220 is a family of five-abreast narrow-body airliners by Airbus Canada Limited Partnership (ACLP). It was originally developed by Bombardier and had two years in service as the Bombardier CSeries. The program was launched on 13 July 2008. The smaller A220-100 made its maiden flight on 16 September 2013, was awarded an initial type certificate by Transport Canada on 18 December 2015, and entered service on 15 July 2016 with launch operator Swiss Global Air Lines. The longer A220-300 first flew on 27 February 2015, received an initial type certificate on 11 July 2016, and entered service with airBaltic on 14 December 2016.

<span class="mw-page-title-main">Blended wing body</span> Aircraft design with no clear divide between fuselage and wing

A blended wing body (BWB), also known as blended body, hybrid wing body (HWB) or a lifting aerofoil fuselage, is a fixed-wing aircraft having no clear dividing line between the wings and the main body of the craft. The aircraft has distinct wing and body structures, which are smoothly blended together with no clear dividing line. This contrasts with a flying wing, which has no distinct fuselage, and a lifting body, which has no distinct wings. A BWB design may or may not be tailless.

<span class="mw-page-title-main">Hydrogen-powered aircraft</span> Type of airplane

A hydrogen-powered aircraft is an aeroplane that uses hydrogen fuel as a power source. Hydrogen can either be burned in a jet engine or another kind of internal combustion engine, or can be used to power a fuel cell to generate electricity to power an electric propulsor. It cannot be stored in a traditional wet wing, and hydrogen tanks have to be housed in the fuselage or be supported by the wing.

The energy efficiency in transport is the useful travelled distance, of passengers, goods or any type of load; divided by the total energy put into the transport propulsion means. The energy input might be rendered in several different types depending on the type of propulsion, and normally such energy is presented in liquid fuels, electrical energy or food energy. The energy efficiency is also occasionally known as energy intensity. The inverse of the energy efficiency in transport is the energy consumption in transport.

<span class="mw-page-title-main">Embraer E-Jet E2 family</span> Regional jet airliner family

The Embraer E-Jet E2 family are medium-range twinjet airliners designed and produced by the Brazilian aircraft manufacturer Embraer. It was developed as a successor to the original E-Jet family.

<span class="mw-page-title-main">Four-engined jet aircraft</span>

A four-engined jet, sometimes called a quadjet, is a jet aircraft powered by four engines. The presence of four engines offers increased power, allowing such aircraft to be used as airliners, freighters, and military aircraft. Many of the first purpose-built jet airliners had four engines, among which stands the De Havilland Comet, the world's first commercial jetliner. In the decades following their introduction, their use has gradually declined due to a variety of factors, including the approval of twin-engine jets to fly farther from diversion airports as reliability increased, and an increased emphasis on fuel efficiency.

A hybrid electric aircraft is an aircraft with a hybrid electric powertrain. As the energy density of lithium-ion batteries is much lower than aviation fuel, a hybrid electric powertrain may effectively increase flight range compared to pure electric aircraft. By May 2018, there were over 30 hybrid electric aircraft projects, and short-haul hybrid-electric airliners were envisioned from 2032.

References

  1. D.S.Lee; et al. (2021), "The contribution of global aviation to anthropogenic climate forcing for 2000 to 2018", Atmospheric Environment , 244: 117834, Bibcode:2021AtmEn.24417834L, doi:10.1016/j.atmosenv.2020.117834, PMC   7468346 , PMID   32895604
  2. 1 2 Brandon Graver; Kevin Zhang; Dan Rutherford (September 2019). "CO2 emissions from commercial aviation, 2018" (PDF). International Council on Clean Transportation.
  3. "Performance > Speed". Aerion. Archived from the original on 20 November 2015. Retrieved 6 April 2017.
  4. Max Kingsley-Jones (15 November 2009). "Dubai 09: A320s sharklets to deliver 3.5% lower fuel burn from 2012". Flight International.
  5. "The impact of winglets on fuel consumption and aircraft emissions". Cirium. Retrieved 24 August 2023.
  6. Barney L. Capehart (2007). Encyclopedia of Energy Engineering and Technology. Vol. 1. CRC Press. ISBN   978-0-8493-3653-9.
  7. Marsh, George (8 April 2014). "Composites flying high (Part 1)". Materials Today. Archived from the original on 16 September 2015. Retrieved 23 May 2015.
  8. Antonio Filippone (2012). Advanced Aircraft Flight Performance. Cambridge University Press. p. 454. ISBN   978-1-139-78966-0.
  9. Park Y., O'Kelly M.E. (2014). Fuel burn rates of commercial passenger aircraft: variations by seat configuration and stage distance. Jrnl. Transp. Geog., 41:pp.137-147.
  10. Why the Longest Nonstop Flights Are Ending, Bloomberg Bus., 31 October 2013.
  11. Andrew Doyle (24 October 2012). "SIA to drop nonstop USA flights as Airbus buys back A340s". flightglobal.com.
  12. Mike Tierney (25 November 2013). "Last Call for the Long Haul From Singapore to Newark". The New York Times. Retrieved 1 April 2016.
  13. Tanya Powley; Peggy Bollinger (6 November 2015). "A new era of 'ultra-long-haul' aviation" . Financial Times. Archived from the original on 4 March 2023. Retrieved 22 December 2016.
  14. Gany, Alon (July 2006). "Effect of Fuel Properties on the Specific Thrust of a Ramjet Engine". Defence Science Journal. 56 (3): 321–328. doi: 10.14429/dsj.56.1895 .
  15. Spakovszky, Zoltan (2009). "Unified Propulsion Lecture 1". Unified Engineering Lecture Notes. MIT.
  16. Dugan, James F.; Miller, Brent A.; Graber, Edwin J.; Sagerser, David A. (1980). "The NASA High-Speed Turboprop Program" (PDF). SAE International: 3397-34115. Archived from the original (PDF) on 24 July 2018.
  17. 1 2 3 4 Irene Kwan (3 June 2014). "Back to the Future: Return of the Turboprop?". The International Council on Clean Transport.
  18. Paul Marks (5 January 2019). "Green sky thinking". New Scientist.
  19. USapplication 2009020643,Airbus&Christophe Cros,"Aircraft having reduced environmental impact",published 22 January 2009
  20. Hager, Roy D.; Vrabel, Deborah (January 1988). "Advanced Turboprop Project". ntrs.nasa.gov. Retrieved 27 January 2022.
  21. European Aviation Safety Agency; EAA (January 2019). European Aviation Environmental Report 2019 (PDF). EASA, EEA and Eurocontrol. p. 7. doi:10.2822/309946. ISBN   978-92-9210-214-2.
  22. "U.S. domestic airline fuel-efficiency ranking 2017-2018" (PDF). ICCT. 12 September 2019.
  23. Bofinger, H.; Strand, J. (May 2013). "Calculating the carbon footprint from different classes of air travel" (PDF). Development Research Group, Env. & Energy Team. World Bank. p. 40.
  24. James Albright (27 February 2016). "Getting the Most Miles from Your Jet-A". Business & Commercial Aviation. Aviation Week.
  25. "SAS flies slower to save costs and emissions". Reuters. 20 May 2008.
  26. "Annual Report" (PDF). Ryanair. July 2016. p. 29.
  27. 1 2 Brandon Graver; Daniel Rutherford (January 2018). "Transpacific airline fuel efficiency ranking, 2016" (PDF). ICCT.
  28. "Sustainable Development Report 2016" (PDF). Cathay Pacific. April 2017. p. 5.
  29. Bjorn Fehrm (26 April 2017). "Aeroflot, the route to a modern airline. Part 3". Leeham Co.
  30. Brandon Graver; Daniel Rutherford (12 September 2018). "Transatlantic airline fuel efficiency ranking, 2017" (PDF). ICCT.
  31. "Tracking Transport: Aviation". International Energy Agency. May 2019.
  32. David Kaminski-Morrow (13 November 2019). "Wizz chief derides airline rivals' zero-carbon pledges". Flightglobal.
  33. Greg Waldron (29 November 2021). "Cebu Pacific takes delivery of high-density A330neo". Flightglobal.
  34. Basic Principles of the Continuous Descent Approach (CDA) for the Non-Aviation Community (PDF), UK Civil Aviation Authority, archived from the original (PDF) on 9 November 2008
  35. "Tests prove electric-drive concept" . Flight Global. 9 August 2005.
  36. "Emission-free airports – DLR develops a fuel cellpowered electric nose wheel for commercial aircraft" (PDF) (Press release). DLR. 1 February 2011.
  37. 1 2 3 Simon Weselby (October 2012). "Fuel Burn vs. Maintenance Costs" (PDF). IATA maintenance cost conference. Airbus.
  38. Operational Opportunities to Minimize Fuel Use and Reduce Emissions (PDF), International Civil Aviation Organization, 2014
  39. 1 2 3 4 5 Jens Flottau (18 November 2019). "Airbus Seeks Up To 10% Fuel Burn Savings By Aircraft Flying Together". Aviation Week Network.
  40. Bjorn Ferhm (20 December 2019). "Why e in ePlane shall stand for environment, Part 2. Fly shorter routes". Leeham News.
  41. "Efficiency Trends for New Commercial Jet Aircraft, 1960 to 2008" (PDF). The International Council on Clean Transportation. November 2009.
  42. 1 2 Peeters, P. M.; et al. (November 2005). "Fuel efficiency of commercial aircraft" (PDF). Netherlands National Aerospace Laboratory. An overview of historical and future trends
  43. Brian M. Yutko and R. John Hansman (May 2011). "Approaches to Representing Aircraft Fuel Efficiency. Performance for the Purpose of a Commercial Aircraft" (PDF). MIT International Center for Air Transportation.
  44. Richard Avellán (2011). On the Design of Energy Efficient Aero Engines (PDF) (Thesis). Chalmers University of Technology.
  45. 1 2 3 4 "CS300 first flight Wednesday, direct challenge to 737-7 and A319neo". Leeham News. 25 February 2015.
  46. Giovanni Bisignani, CEO of the IATA (20 September 2007). "Opinion: Aviation and global warming". New York Times.
  47. Joyce E. Penner; et al. (1999), "9.2.2. Developments in Technology", Special Report on Aviation and the Global Atmosphere, IPCC
  48. Anastasia Kharina; Daniel Rutherford (August 2015), Fuel efficiency trends for new commercial jet aircraft: 1960 to 2014 (PDF), ICCT
  49. "The A380: The future of flying". Airbus. Archived from the original on 14 December 2007. Retrieved 22 March 2008.
  50. Boeing 787 Technology, Boeing
  51. Timmis, A.; et al. (1 January 2015). "Environmental impact assessment of aviation emission reduction through the implementation of composite materials". The International Journal of Life Cycle Assessment. 20 (2): 233–243. doi:10.1007/s11367-014-0824-0. S2CID   55899619.
  52. "Modern, Quiet and Environmentally Efficient: Lufthansa Group Orders 59 Ultra-Modern Wide-Body Boeing 777-9X and Airbus A350-900 Aircraft" (PDF) (Press release). Lufthansa. 19 September 2013. Archived from the original (PDF) on 23 October 2017.
  53. Richard Maslen (20 February 2015). "WOW air Sources A321s for Transatlantic Launch". Routesonline.
  54. "Airbus reports emissions data amid climate pressure". Reuters. 26 February 2021.
  55. 1 2 3 4 5 6 "AN-148/AN-158 family overview" (PDF). Antonov. 2017. Archived from the original (PDF) on 18 February 2018.
  56. 1 2 "Fuel saving" (PDF). ATR. January 2011.
  57. Mark Brouwer, Siddharth Srinivasan (10 November 2011). "Proud to fly a Turboprop: Q400 vs ATR72". The Flying Engineer.
  58. "ATR 72-600 The first choice for operators".
  59. "Beechcraft 1900D: Fuel, Emissions & Cost Savings Operational Analysis" (PDF). Specific Range Solutions Ltd. 21 February 2012.
  60. 1 2 3 4 5 6 7 8 "CRJ family fuel-burn performance" (PDF). Aircraft Commerce. October 2009.
  61. Mark Brouwer, Siddharth Srinivasan (10 November 2011). "Proud to fly a Turboprop: Q400 vs ATR72". The Flying Engineer.
  62. "Dornier 228 Advanced Commuter Brochure". RUAG.
  63. "Dornier 328-100 (TP)" (PDF). 328 Support Services GmbH. 2013.
  64. "120 Brasilia Sales Brochure". Embraer. p. 8.
  65. 1 2 3 4 "Owner's & Operator's Guide: ERJ-135/-140/-145" (PDF). Aircraft Commerce. December 2008.
  66. 1 2 "Saab 340A data sheet" (PDF). Saab Aircraft Leasing. 2009.
  67. 1 2 "Saab 2000 data sheet" (PDF). Saab Aircraft Leasing. 2009.
  68. 1 2 3 4 5 6 7 "Embraer continues and refines its strategy at the low-end of 100-149 seat sector". Leeham News. 13 January 2014.
  69. 1 2 "CS100 environmental product declaration" (PDF). Bombardier. 27 September 2016. Archived from the original (PDF) on 11 December 2016.
  70. 1 2 3 "CS300 environmental product declaration" (PDF). Bombardier. 27 September 2017.
  71. 1 2 3 4 5 6 "ANALYSIS: A320neo vs. 737 MAX: Airbus is Leading (Slightly) – Part II". Airways News. 5 February 2016. Archived from the original on 6 February 2016.
  72. "Air Investor 2021 p.43". Air Finance Journal. January 2021.
  73. "Air Investor 2021 p.44". Air Finance Journal. January 2021.
  74. 1 2 Scott McCartney (12 August 2010). "A Prius With Wings vs. a Guzzler in the Clouds". Wall Street Journal.
  75. 1 2 3 4 5 6 7 8 "737 performance summary" (PDF). Boeing. 2007. Archived from the original (PDF) on 25 July 2014.
  76. 1 2 3 4 "757 performance summary" (PDF). Boeing. 2007.
  77. "Bombardier CRJ1000 Fuel Consumption". Sun Airlines. 20 August 2013.
  78. "Q400 Fuel efficiency manual" (PDF). Bombardier. 2014.
  79. "Q400 Fuel efficiency manual" (PDF). Bombardier. 2014.
  80. "Dornier 328-100 (TP)" (PDF). 328 Support Services GmbH. 2013.
  81. "Air Investor 2021, p.51". Air Finance Journal. January 2021.
  82. "Air Investor 2021, p.52". Air Finance Journal. January 2021.
  83. 1 2 3 4 "Owner's & Operator's Guide: E-Jets family" (PDF). Aircraft Commerce. June 2009.
  84. "PC-12 NG Just The Facts" (PDF). Pilatus. 20 October 2015. Archived from the original (PDF) on 9 October 2016. Retrieved 27 July 2016.
  85. "Sukhoi SSJ100, Embraer ERJ190, Airbus A319 Operational and Economic Comparison". Sukhoi. March 2013.
  86. "Air Investor 2021 p.36". Air Finance Journal. January 2021.
  87. 1 2 3 4 5 6 7 "Analysing the options for 757 replacement" (PDF). Aircraft Commerce. August 2005. Archived from the original (PDF) on 17 September 2012. Retrieved 16 July 2014.
  88. "Air Investor 2021". Air Finance Journal. January 2021.
  89. "Air Investor 2021 p.39". Air Finance Journal. January 2021.
  90. 1 2 3 4 "Boeing 737 MAX: performance with reported engine SFC shortfall". Leeham News. 15 April 2015.
  91. "Air Investor 2021, p.48". Air Finance Journal. January 2021.
  92. "Air Investor 2021, p.48". Air Finance Journal. January 2021.
  93. "Air Investor 2021, p.48". Air Finance Journal. January 2021.
  94. "Kodiak Brochure" (PDF). Quest Aircraft. April 2014. Archived from the original (PDF) on 8 February 2017. Retrieved 20 February 2017.
  95. "Distance from JFK to LHR". great circle mapper.
  96. 1 2 3 Anja Kollmuss & Jessica Lane (May 2008). "Carbon Offset Calculators for Air Travel" (PDF). Stockholm Environment Institute. Archived from the original (PDF) on 31 December 2010. Retrieved 20 February 2017.
  97. 1 2 3 4 5 Bjorn Fehrm (25 February 2015). "Redefining the 757 replacement: Requirement for the 225/5000 Sector". Leeham News.
  98. 1 2 3 4 5 6 7 "Boeing: 777 way much better than A330". Aspire aviation. 8 December 2010.
  99. 1 2 3 4 5 Vinay Bhaskara (25 November 2014). "UPDATED ANALYSIS: Delta Order for A350; A330neo Hinged on Pricing, Availability". Airways News. Archived from the original on 17 November 2015. Retrieved 28 November 2014.
  100. "Air Investor 2021, p.43". Air Finance Journal. January 2021.
  101. 1 2 "737 MAX 8 could be enabler for some LCC Long Haul". Leeham News. 8 December 2014.
  102. 1 2 "747-8 performance summary" (PDF). Boeing. 2010. Archived from the original (PDF) on 24 July 2014.
  103. 1 2 3 4 5 6 "767 performance summary" (PDF). Boeing. 2006. Archived from the original (PDF) on 15 April 2015.
  104. 1 2 3 4 "777 performance summary" (PDF). Boeing. 2009. Archived from the original (PDF) on 4 January 2014.
  105. David Kaminski-Morrow (4 June 2018). "Aeroflot outlines performance expectations for MC-21s". Flight Global.
  106. "Distance from HKG to SFO". great circle mapper.
  107. 1 2 3 4 5 6 7 8 9 10 11 12 13 14 Lufthansa Systems' Lido/Flight via "A350-900/-1000 fuel burn & operating performance" (PDF). Aircraft Commerce. December 2018.
  108. 1 2 3 4 "ANALYSIS: The Boeing 787-8 and Airbus A330-800neo are Far From Dead". Airways News. 17 March 2016.
  109. 1 2 "Airbus A350: is the Xtra making the difference ?". Aspire Aviation. 8 June 2015.
  110. 1 2 3 4 "Updating the A380: the prospect of a neo version and what's involved". leeham news. 3 February 2014.
  111. "What Might an Engine Improvement and Sharklets Provide?". Air Insight. 4 July 2016.
  112. "747 performance summary" (PDF). Boeing. 2010. Archived from the original (PDF) on 25 July 2014.
  113. Edward Jobson (12 September 2013). "Coach fuel consumption". volvo buses.
  114. DEFRA (2008). 2008 Guidelines to Defra's GHG Conversion Factors: Methodology Paper for Transport Emission Factors Archived 5 January 2012 at the Wayback Machine
  115. "2014 Toyota Prius fuel economy". United States Environmental Protection Agency.
  116. "Records > Aeroplane efficiency > Current". Fédération Aéronautique Internationale.
  117. "MCR4S Brochure" (PDF). SE Aviation Aircraft. August 2021.
  118. "Fuel Burn Rates for Private Aircraft". SherpaReport. 15 September 2015.
  119. Hank Green (8 October 2007). "Fuel Efficient Plane Prototype Hits Skies". Ecogeek. Archived from the original on 14 July 2014. Retrieved 6 July 2014.
  120. Tom Koehler (27 October 2006). "Boeing to Begin Ground Testing of X-48B Blended Wing Body Concept" (Press release). Boeing. Retrieved 10 April 2012.
  121. Philip Lorenz III (3 July 2007). "AEDC testing brings unique blended wing aircraft closer to flight". Arnold Air Force Base. Archived from the original on 14 July 2014. Retrieved 10 April 2012.
  122. Mahony, Melissa (25 May 2010). "A sharkskin coating for ships, planes and blades". SmartPlanet. Retrieved 29 September 2012.
  123. 1 2 "Technology Roadmap for Environmental Improvement - Fact Sheet" (PDF). IATA. December 2019. Archived from the original (PDF) on 29 June 2020.
  124. 1 2 3 4 Graham Warwick (6 May 2016). "Problems Aerospace Still Has To Solve". Aviation Week & Space Technology.
  125. 1 2 3 4 5 6 7 8 9 10 Graham Warwick (27 January 2017). "When Will These Civil Aircraft Concepts Fly?". Aviation Week & Space Technology.
  126. Stephen Trimble (24 October 2017). "Aurora Flight Sciences to evaluate NASA electric airliner design". Flightglobal.
  127. Ludovic Wiart; et al. (July 2015). Development of NOVA Aircraft Configurations for Large Engine Integration Studies. AIAA Aviation 2015, Dallas, TX. ONERA. doi:10.2514/6.2015-2254.
  128. Paul Peeters (15 November 2017). Tourism's impact on climate change and its mitigation challenges: How can tourism become 'climatically sustainable'? (PhD). TU Delft. p. 187.