
A geographic information system (GIS) consists of integrated computer hardware and software that store, manage, analyze, edit, output, and visualize geographic data. Much of this often happens within a spatial database, however, this is not essential to meet the definition of a GIS. In a broader sense, one may consider such a system also to include human users and support staff, procedures and workflows, the body of knowledge of relevant concepts and methods, and institutional organizations.
A world file is a six line plain text sidecar file used by geographic information systems (GIS) to georeference raster map images. The file specification was introduced by Esri.

Environmental Systems Research Institute, Inc., doing business as Esri, is an American multinational geographic information system (GIS) software company headquartered in Redlands, California. It is best known for its ArcGIS products. With a 40% market share, Esri is the world's leading supplier of GIS software, web GIS and geodatabase management applications.
A GIS file format is a standard for encoding geographical information into a computer file, as a specialized type of file format for use in geographic information systems (GIS) and other geospatial applications. Since the 1970s, dozens of formats have been created based on various data models for various purposes. They have been created by government mapping agencies, GIS software vendors, standards bodies such as the Open Geospatial Consortium, informal user communities, and even individual developers.

System for Automated Geoscientific Analyses is a geographic information system (GIS) computer program, used to edit spatial data. It is free and open-source software, developed originally by a small team at the Department of Physical Geography, University of Göttingen, Germany, and is now being maintained and extended by an international developer community.
A GIS software program is a computer program to support the use of a geographic information system, providing the ability to create, store, manage, query, analyze, and visualize geographic data, that is, data representing phenomena for which location is important. The GIS software industry encompasses a broad range of commercial and open-source products that provide some or all of these capabilities within various information technology architectures.
A Web Map Service (WMS) is a standard protocol developed by the Open Geospatial Consortium in 1999 for serving georeferenced map images over the Internet. These images are typically produced by a map server from data provided by a GIS database.

ArcGIS is a family of client, server and online geographic information system (GIS) software developed and maintained by Esri.

gvSIG, geographic information system (GIS), is a desktop application designed for capturing, storing, handling, analyzing and deploying any kind of referenced geographic information in order to solve complex management and planning problems. gvSIG is known for having a user-friendly interface, being able to access the most common formats, both vector and raster ones. It features a wide range of tools for working with geographic-like information.
Georeferencing or georegistration is a type of coordinate transformation that binds a digital raster image or vector database that represents a geographic space to a spatial reference system, thus locating the digital data in the real world. It is thus the geographic form of image registration. The term can refer to the mathematical formulas used to perform the transformation, the metadata stored alongside or within the image file to specify the transformation, or the process of manually or automatically aligning the image to the real world to create such metadata. The most common result is that the image can be visually and analytically integrated with other geographic data in geographic information systems and remote sensing software.

The Geospatial Data Abstraction Library (GDAL) is a computer software library for reading and writing raster and vector geospatial data formats, and is released under the permissive X/MIT style free software license by the Open Source Geospatial Foundation. As a library, it presents a single abstract data model to the calling application for all supported formats. It may also be built with a variety of useful command line interface utilities for data translation and processing. Projections and transformations are supported by the PROJ library.
A geographic data model, geospatial data model, or simply data model in the context of geographic information systems, is a mathematical and digital structure for representing phenomena over the Earth. Generally, such data models represent various aspects of these phenomena by means of geographic data, including spatial locations, attributes, change over time, and identity. For example, the vector data model represents geography as collections of points, lines, and polygons, and the raster data model represent geography as cell matrices that store numeric values. Data models are implemented throughout the GIS ecosystem, including the software tools for data management and spatial analysis, data stored in a variety of GIS file formats, specifications and standards, and specific designs for GIS installations.
The following tables compare general and technical information for a number of GIS vector file format. Please see the individual products' articles for further information. Unless otherwise specified in footnotes, comparisons are based on the stable versions without any add-ons, extensions or external programs.

ArcGIS CityEngine is a commercial three-dimensional (3D) modeling program developed by Esri R&D Center Zurich and specialises in the generation of 3D urban environments. Using a procedural modeling approach, it supports the creation of detailed large-scale 3D city models. CityEngine works with architectural object placement and arrangement in the same manner that software like VUE manages terrain, ecosystems and atmosphere mapping. Unlike the traditional 3D modeling methodology which uses Computer-Aided Design (CAD) tools and techniques, CityEngine takes a different approach to shape generation via a rule-based system. It can also use Geographic Information System (GIS) datasets due to its integration with the wider Esri/ArcGIS platform. Due to this unique feature set, CityEngine has been used in academic research and built environment professions, e.g., urban planning, architecture, visualization, game development, entertainment, archeology, military and cultural heritage. CityEngine can be used within Building Information Model (BIM) workflows as well as visualizing the data of buildings in a larger urban context, enhancing its working scenario toward real construction projects.
Geospatial PDF is a set of geospatial extensions to the Portable Document Format (PDF) 1.7 specification to include information that relates a region in the document page to a region in physical space — called georeferencing. A geospatial PDF can contain geometry such as points, lines, and polygons. These, for example, could represent building locations, road networks and city boundaries, respectively. The georeferencing metadata for geospatial PDF is most commonly encoded in one of two ways: the OGC best practice; and as Adobe's proposed geospatial extensions to ISO 32000. The specifications also allow geometry to have attributes, such as a name or identifying type.

Geospatial topology is the study and application of qualitative spatial relationships between geographic features, or between representations of such features in geographic information, such as in geographic information systems (GIS). For example, the fact that two regions overlap or that one contains the other are examples of topological relationships. It is thus the application of the mathematics of topology to GIS, and is distinct from, but complementary to the many aspects of geographic information that are based on quantitative spatial measurements through coordinate geometry. Topology appears in many aspects of geographic information science and GIS practice, including the discovery of inherent relationships through spatial query, vector overlay and map algebra; the enforcement of expected relationships as validation rules stored in geospatial data; and the use of stored topological relationships in applications such as network analysis. Spatial topology is the generalization of geospatial topology for non-geographic domains, e.g., CAD software.
Vector tiles, tiled vectors or vectiles are packets of geographic data, packaged into pre-defined roughly-square shaped "tiles" for transfer over the web. This is an emerging method for delivering styled web maps, combining certain benefits of pre-rendered raster map tiles with vector map data. As with the widely used raster tiled web maps, map data is requested by a client as a set of "tiles" corresponding to square areas of land of a pre-defined size and location. Unlike raster tiled web maps, however, the server returns vector map data, which has been clipped to the boundaries of each tile, instead of a pre-rendered map image.
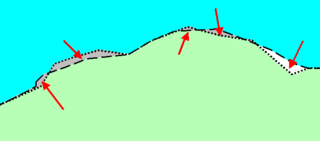
A sliver polygon, in the context of Geographic Information Systems (GIS), is a small polygon found in vector data that is an artifact of error rather than representing a real-world feature. They have been a recognized source of error since overlay was first invented in the 1970s.
Vector overlay is an operation in a geographic information system (GIS) for integrating two or more vector spatial data sets. Terms such as polygon overlay, map overlay, and topological overlay are often used synonymously, although they are not identical in the range of operations they include. Overlay has been one of the core elements of spatial analysis in GIS since its early development. Some overlay operations, especially Intersect and Union, are implemented in all GIS software and are used in a wide variety of analytical applications, while others are less common.
A Geodatabase is a proprietary GIS file format developed in the late 1990s by Esri to represent, store, and organize spatial datasets within a geographic information system. A geodatabase is both a logical data model and the physical implementation of that logical model in several proprietary file formats released during the 2000s. The geodatabase design is based on the spatial database model for storing spatial data in relational and object-relational databases. Given the dominance of Esri in the GIS industry, the term "geodatabase" is used by some as a generic trademark for any spatial database, regardless of platform or design.