
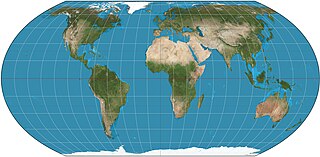
The Mercator projection is a conformal cylindrical map projection presented by Flemish geographer and cartographer Gerardus Mercator in 1569. It became the standard map projection for navigation due to its ability to represent north as "up" and south as "down" everywhere while preserving local directions and shapes. However, as a result, the Mercator projection inflates the size of objects the further they are from the equator. In a Mercator projection, landmasses such as Greenland and Antarctica appear far larger than they actually are relative to landmasses near the equator. Despite these drawbacks, the Mercator projection is well-suited to marine navigation and internet web maps and continues to be widely used today.
In probability theory, the Borel–Kolmogorov paradox is a paradox relating to conditional probability with respect to an event of probability zero. It is named after Émile Borel and Andrey Kolmogorov.
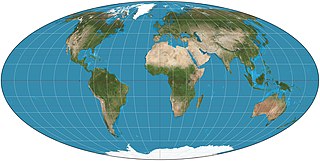
The Mollweide projection is an equal-area, pseudocylindrical map projection generally used for maps of the world or celestial sphere. It is also known as the Babinet projection, homalographic projection, homolographic projection, and elliptical projection. The projection trades accuracy of angle and shape for accuracy of proportions in area, and as such is used where that property is needed, such as maps depicting global distributions.

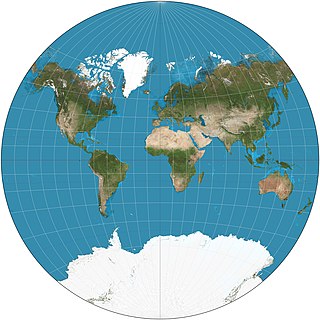
The azimuthal equidistant projection is an azimuthal map projection. It has the useful properties that all points on the map are at proportionally correct distances from the center point, and that all points on the map are at the correct azimuth (direction) from the center point. A useful application for this type of projection is a polar projection which shows all meridians as straight, with distances from the pole represented correctly.

The scale of a map is the ratio of a distance on the map to the corresponding distance on the ground. This simple concept is complicated by the curvature of the Earth's surface, which forces scale to vary across a map. Because of this variation, the concept of scale becomes meaningful in two distinct ways.
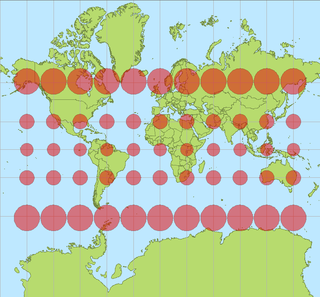
In cartography, a Tissot's indicatrix is a mathematical contrivance presented by French mathematician Nicolas Auguste Tissot in 1859 and 1871 in order to characterize local distortions due to map projection. It is the geometry that results from projecting a circle of infinitesimal radius from a curved geometric model, such as a globe, onto a map. Tissot proved that the resulting diagram is an ellipse whose axes indicate the two principal directions along which scale is maximal and minimal at that point on the map.
The Albers equal-area conic projection, or Albers projection, is a conic, equal area map projection that uses two standard parallels. Although scale and shape are not preserved, distortion is minimal between the standard parallels.
The Collignon projection is an equal-area pseudocylindrical map projection first known to be published by Édouard Collignon in 1865 and subsequently cited by A. Tissot in 1881.
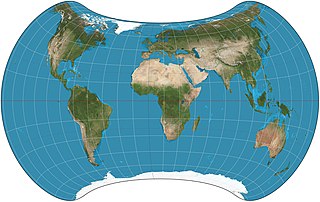
The van der Grinten projection is a compromise map projection, which means that it is neither equal-area nor conformal. Unlike perspective projections, the van der Grinten projection is an arbitrary geometric construction on the plane. Van der Grinten projects the entire Earth into a circle. It largely preserves the familiar shapes of the Mercator projection while modestly reducing Mercator's distortion. Polar regions are subject to extreme distortion. Lines of longitude converge to points at the poles.

The Hammer projection is an equal-area map projection described by Ernst Hammer in 1892. Using the same 2:1 elliptical outer shape as the Mollweide projection, Hammer intended to reduce distortion in the regions of the outer meridians, where it is extreme in the Mollweide.

The Tobler hyperelliptical projection is a family of equal-area pseudocylindrical projections that may be used for world maps. Waldo R. Tobler introduced the construction in 1973 as the hyperelliptical projection, now usually known as the Tobler hyperelliptical projection.

Wagner VI is a pseudocylindrical whole Earth map projection. Like the Robinson projection, it is a compromise projection, not having any special attributes other than a pleasing, low distortion appearance. Wagner VI is equivalent to the Kavrayskiy VII horizontally elongated by a factor of ⁄. This elongation results in proper preservation of shapes near the equator but slightly more distortion overall. The aspect ratio of this projection is 2:1, as formed by the ratio of the equator to the central meridian. This matches the ratio of Earth’s equator to any meridian.

The Eckert IV projection is an equal-area pseudocylindrical map projection. The length of the polar lines is half that of the equator, and lines of longitude are semiellipses, or portions of ellipses. It was first described by Max Eckert in 1906 as one of a series of three pairs of pseudocylindrical projections. Within each pair, meridians are the same whereas parallels differ. Odd-numbered projections have parallels spaced equally, whereas even-numbered projections have parallels spaced to preserve area. Eckert IV is paired with Eckert III.

The Eckert II projection is an equal-area pseudocylindrical map projection. In the equatorial aspect the network of longitude and latitude lines consists solely of straight lines, and the outer boundary has the distinctive shape of an elongated hexagon. It was first described by Max Eckert in 1906 as one of a series of three pairs of pseudocylindrical projections. Within each pair, the meridians have the same shape, and the odd-numbered projection has equally spaced parallels, whereas the even-numbered projection has parallels spaced to preserve area. The pair to Eckert II is the Eckert I projection.

The Ortelius oval projection is a map projection used for world maps largely in the late 16th and early 17th century. It is neither conformal nor equal-area but instead offers a compromise presentation. It is similar in structure to a pseudocylindrical projection but does not qualify as one because the meridians are not equally spaced along the parallels. The projection's first known use was by Battista Agnese around 1540, although whether the construction method was truly identical to Ortelius's or not is unclear because of crude drafting and printing. The front hemisphere is identical to Petrus Apianus's 1524 globular projection.
The Equal Earth map projection is an equal-area pseudocylindrical global map projection, invented by Bojan Šavrič, Bernhard Jenny, and Tom Patterson in 2018. It is inspired by the widely used Robinson projection, but unlike the Robinson projection, retains the relative size of areas. The projection equations are simple to implement and fast to evaluate.
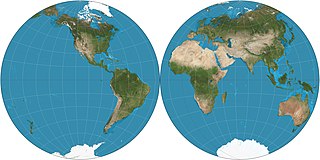
The Nicolosi globular projection is a polyconic map projection invented about the year 1000 by the Iranian polymath al-Biruni. As a circular representation of a hemisphere, it is called globular because it evokes a globe. It can only display one hemisphere at a time and so normally appears as a "double hemispheric" presentation in world maps. The projection came into use in the Western world starting in 1660, reaching its most common use in the 19th century. As a "compromise" projection, it preserves no particular properties, instead giving a balance of distortions.
The Strebe 1995 projection, Strebe projection, Strebe lenticular equal-area projection, or Strebe equal-area polyconic projection is an equal-area map projection presented by Daniel "daan" Strebe in 1994. Strebe designed the projection to keep all areas proportionally correct in size; to push as much of the inevitable distortion as feasible away from the continental masses and into the Pacific Ocean; to keep a familiar equatorial orientation; and to do all this without slicing up the map.
The Eckert-Greifendorff projection is an equal-area map projection described by Max Eckert-Greifendorff in 1935. Unlike his previous six projections, it is not pseudocylindrical.
In cartography, an equivalent, authalic, or equal-area projection is a map projection that preserves relative area measure between any and all map regions. Equivalent projections are widely used for thematic maps showing scenario distribution such as population, farmland distribution, forested areas, and so forth, because an equal-area map does not change apparent density of the phenomenon being mapped.


