
The Gall–Peters projection is a rectangular, equal-area map projection. Like all equal-area projections, it distorts most shapes. It is a cylindrical equal-area projection with latitudes 45° north and south as the regions on the map that have no distortion. The projection is named after James Gall and Arno Peters.

In geography, latitude is a coordinate that specifies the north–south position of a point on the surface of the Earth or another celestial body. Latitude is given as an angle that ranges from −90° at the south pole to 90° at the north pole, with 0° at the Equator. Lines of constant latitude, or parallels, run east–west as circles parallel to the equator. Latitude and longitude are used together as a coordinate pair to specify a location on the surface of the Earth.

The Mercator projection is a conformal cylindrical map projection first presented by Flemish geographer and mapmaker Gerardus Mercator in 1569. In the 18th century, it became the standard map projection for navigation due to its property of representing rhumb lines as straight lines. When applied to world maps, the Mercator projection inflates the size of lands the further they are from the equator. Therefore, landmasses such as Greenland and Antarctica appear far larger than they actually are relative to landmasses near the equator. Nowadays the Mercator projection is widely used because, aside from marine navigation, it is well suited for internet web maps.
In cartography, a map projection is any of a broad set of transformations employed to represent the curved two-dimensional surface of a globe on a plane. In a map projection, coordinates, often expressed as latitude and longitude, of locations from the surface of the globe are transformed to coordinates on a plane. Projection is a necessary step in creating a two-dimensional map and is one of the essential elements of cartography.

The Robinson projection is a map projection of a world map that shows the entire world at once. It was specifically created in an attempt to find a good compromise to the problem of readily showing the whole globe as a flat image.
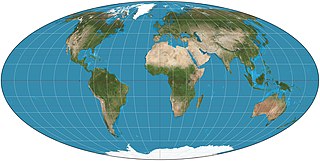
The Mollweide projection is an equal-area, pseudocylindrical map projection generally used for maps of the world or celestial sphere. It is also known as the Babinet projection, homalographic projection, homolographic projection, and elliptical projection. The projection trades accuracy of angle and shape for accuracy of proportions in area, and as such is used where that property is needed, such as maps depicting global distributions.
John Paul Goode, a geographer and cartographer, was one of the key geographers in American geography's Incipient Period from 1900 to 1940. Goode was born in Stewartville, Minnesota on November 21, 1862. Goode received his bachelor's degree from the University of Minnesota 1889 and his doctorate in economics from the University of Pennsylvania in 1903. Goode got his first teaching job at Moorhead Normal School in 1889 where he taught geology, chemistry, physics, anatomy, botany and physiology. He married Ida Katherine Hancock, a physiology and arithmetic instructor at the school since 1897, in 1901 in Crookston, MN. By late 1901, Goode and Ida moved to Charleston, IL as a member of the faculty at Eastern Illinois State Normal School, where he taught physics and geography. Later on in 1903, he was offered a position as a professor in the Geography Department at the University of Chicago.

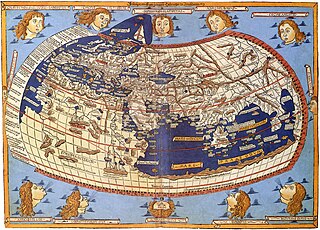
The equirectangular projection, and which includes the special case of the plate carrée projection, is a simple map projection attributed to Marinus of Tyre, who Ptolemy claims invented the projection about AD 100.

The sinusoidal projection is a pseudocylindrical equal-area map projection, sometimes called the Sanson–Flamsteed or the Mercator equal-area projection. Jean Cossin of Dieppe was one of the first mapmakers to use the sinusoidal, using it in a world map in 1570.

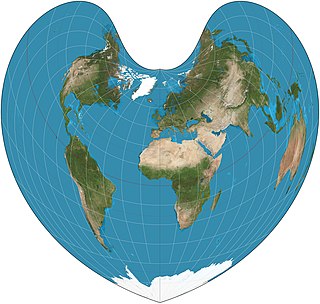
The Werner projection is a pseudoconic equal-area map projection sometimes called the Stab-Werner or Stabius-Werner projection. Like other heart-shaped projections, it is also categorized as cordiform. Stab-Werner refers to two originators: Johannes Werner (1466–1528), a parish priest in Nuremberg, refined and promoted this projection that had been developed earlier by Johannes Stabius (Stab) of Vienna around 1500.
The Bonne projection is a pseudoconical equal-area map projection, sometimes called a dépôt de la guerre, modified Flamsteed, or a Sylvanus projection. Although named after Rigobert Bonne (1727–1795), the projection was in use prior to his birth, in 1511 by Sylvanus, Honter in 1561, De l'Isle before 1700 and Coronelli in 1696. Both Sylvanus and Honter's usages were approximate, however, and it is not clear they intended to be the same projection.

The Aitoff projection is a modified azimuthal map projection proposed by David A. Aitoff in 1889. Based on the equatorial form of the azimuthal equidistant projection, Aitoff first halves longitudes, then projects according to the azimuthal equidistant, and then stretches the result horizontally into a 2:1 ellipse to compensate for having halved the longitudes.

The Hammer projection is an equal-area map projection described by Ernst Hammer in 1892. Using the same 2:1 elliptical outer shape as the Mollweide projection, Hammer intended to reduce distortion in the regions of the outer meridians, where it is extreme in the Mollweide.

The Tobler hyperelliptical projection is a family of equal-area pseudocylindrical projections that may be used for world maps. Waldo R. Tobler introduced the construction in 1973 as the hyperelliptical projection, now usually known as the Tobler hyperelliptical projection.

In cartography, the normal cylindrical equal-area projection is a family of normal cylindrical, equal-area map projections.

The Waterman "Butterfly" World Map is a map projection created by Steve Waterman. Waterman first published a map in this arrangement in 1996. The arrangement is an unfolding of a polyhedral globe with the shape of a truncated octahedron, evoking the butterfly map principle first developed by Bernard J.S. Cahill (1866–1944) in 1909. Cahill and Waterman maps can be shown in various profiles, typically linked at the north Pacific or north Atlantic oceans.

The Boggs eumorphic projection is a pseudocylindrical, equal-area map projection used for world maps. Normally it is presented with multiple interruptions. Its equal-area property makes it useful for presenting spatial distribution of phenomena. The projection was developed in 1929 by Samuel Whittemore Boggs (1889–1954) to provide an alternative to the Mercator projection for portraying global areal relationships. Boggs was geographer for the United States Department of State from 1924 until his death. The Boggs eumorphic projection has been used occasionally in textbooks and atlases.

In map projections, an interruption is any place where the globe has been split. All map projections are interrupted at at least one point. Typical world maps are interrupted along an entire meridian. In that typical case, the interruption forms an east/west boundary, even though the globe has no boundaries.
In cartography, an equivalent, authalic, or equal-area projection is a map projection that preserves relative area measure between any and all map regions. Equivalent projections are widely used for thematic maps showing scenario distribution such as population, farmland distribution, forested areas, and so forth, because an equal-area map does not change apparent density of the phenomenon being mapped.

