
The Mercator projection is a conformal cylindrical map projection presented by Flemish geographer and cartographer Gerardus Mercator in 1569. It became the standard map projection for navigation due to its ability to represent north as "up" and south as "down" everywhere while preserving local directions and shapes. However, as a result, the Mercator projection inflates the size of objects the further they are from the equator. In a Mercator projection, landmasses such as Greenland and Antarctica appear far larger than they actually are relative to landmasses near the equator. Despite these drawbacks, the Mercator projection is well-suited to marine navigation and internet web maps and continues to be widely used today.

In mathematics and physics, Laplace's equation is a second-order partial differential equation named after Pierre-Simon Laplace, who first studied its properties. This is often written as or where is the Laplace operator, is the divergence operator, is the gradient operator, and is a twice-differentiable real-valued function. The Laplace operator therefore maps a scalar function to another scalar function.

The Navier–Stokes equations are partial differential equations which describe the motion of viscous fluid substances. They were named after French engineer and physicist Claude-Louis Navier and the Irish physicist and mathematician George Gabriel Stokes. They were developed over several decades of progressively building the theories, from 1822 (Navier) to 1842–1850 (Stokes).
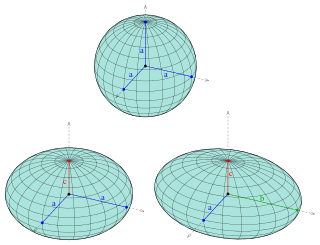
An ellipsoid is a surface that can be obtained from a sphere by deforming it by means of directional scalings, or more generally, of an affine transformation.

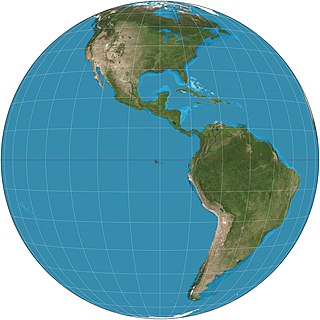
Orthographic projection in cartography has been used since antiquity. Like the stereographic projection and gnomonic projection, orthographic projection is a perspective projection in which the sphere is projected onto a tangent plane or secant plane. The point of perspective for the orthographic projection is at infinite distance. It depicts a hemisphere of the globe as it appears from outer space, where the horizon is a great circle. The shapes and areas are distorted, particularly near the edges.
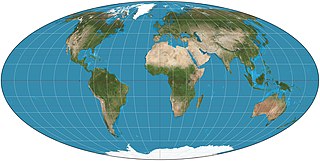
The Mollweide projection is an equal-area, pseudocylindrical map projection generally used for maps of the world or celestial sphere. It is also known as the Babinet projection, homalographic projection, homolographic projection, and elliptical projection. The projection trades accuracy of angle and shape for accuracy of proportions in area, and as such is used where that property is needed, such as maps depicting global distributions.

The azimuthal equidistant projection is an azimuthal map projection. It has the useful properties that all points on the map are at proportionally correct distances from the center point, and that all points on the map are at the correct azimuth (direction) from the center point. A useful application for this type of projection is a polar projection which shows all meridians as straight, with distances from the pole represented correctly.

The scale of a map is the ratio of a distance on the map to the corresponding distance on the ground. This simple concept is complicated by the curvature of the Earth's surface, which forces scale to vary across a map. Because of this variation, the concept of scale becomes meaningful in two distinct ways.
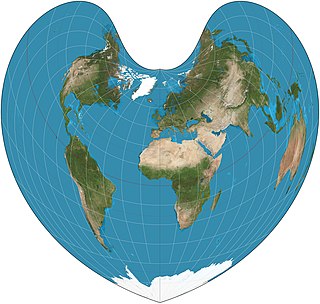
The Bonne projection is a pseudoconical equal-area map projection, sometimes called a dépôt de la guerre, modified Flamsteed, or a Sylvanus projection. Although named after Rigobert Bonne (1727–1795), the projection was in use prior to his birth, in 1511 by Sylvanus, Honter in 1561, De l'Isle before 1700 and Coronelli in 1696. Both Sylvanus and Honter's usages were approximate, however, and it is not clear they intended to be the same projection.
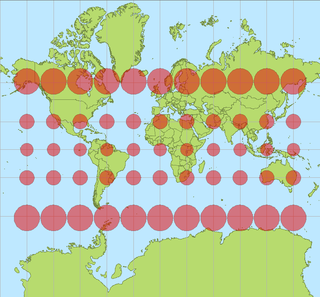
In cartography, a Tissot's indicatrix is a mathematical contrivance presented by French mathematician Nicolas Auguste Tissot in 1859 and 1871 in order to characterize local distortions due to map projection. It is the geometry that results from projecting a circle of infinitesimal radius from a curved geometric model, such as a globe, onto a map. Tissot proved that the resulting diagram is an ellipse whose axes indicate the two principal directions along which scale is maximal and minimal at that point on the map.

In mathematics (specifically multivariable calculus), a multiple integral is a definite integral of a function of several real variables, for instance, f(x, y) or f(x, y, z).

A Lambert conformal conic projection (LCC) is a conic map projection used for aeronautical charts, portions of the State Plane Coordinate System, and many national and regional mapping systems. It is one of seven projections introduced by Johann Heinrich Lambert in his 1772 publication Anmerkungen und Zusätze zur Entwerfung der Land- und Himmelscharten.

The Cassini projection is a map projection first described in an approximate form by César-François Cassini de Thury in 1745. Its precise formulas were found through later analysis by Johann Georg von Soldner around 1810. It is the transverse aspect of the equirectangular projection, in that the globe is first rotated so the central meridian becomes the "equator", and then the normal equirectangular projection is applied. Considering the earth as a sphere, the projection is composed of the operations:
The General Perspective projection is a map projection. When the Earth is photographed from space, the camera records the view as a perspective projection. When the camera is aimed toward the center of the Earth, the resulting projection is called Vertical Perspective. When aimed in other directions, the resulting projection is called a Tilted Perspective.
In mathematics, vector spherical harmonics (VSH) are an extension of the scalar spherical harmonics for use with vector fields. The components of the VSH are complex-valued functions expressed in the spherical coordinate basis vectors.
In fluid dynamics, the Oseen equations describe the flow of a viscous and incompressible fluid at small Reynolds numbers, as formulated by Carl Wilhelm Oseen in 1910. Oseen flow is an improved description of these flows, as compared to Stokes flow, with the (partial) inclusion of convective acceleration.

The equidistant conic projection is a conic map projection commonly used for maps of small countries as well as for larger regions such as the continental United States that are elongated east-to-west.
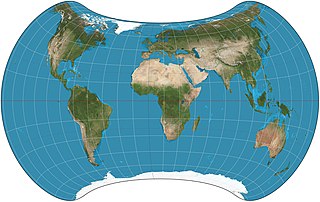
The Strebe 1995 projection, Strebe projection, Strebe lenticular equal-area projection, or Strebe equal-area polyconic projection is an equal-area map projection presented by Daniel "daan" Strebe in 1994. Strebe designed the projection to keep all areas proportionally correct in size; to push as much of the inevitable distortion as feasible away from the continental masses and into the Pacific Ocean; to keep a familiar equatorial orientation; and to do all this without slicing up the map.
In cartography, an equivalent, authalic, or equal-area projection is a map projection that preserves relative area measure between any and all map regions. Equivalent projections are widely used for thematic maps showing scenario distribution such as population, farmland distribution, forested areas, and so forth, because an equal-area map does not change apparent density of the phenomenon being mapped.


