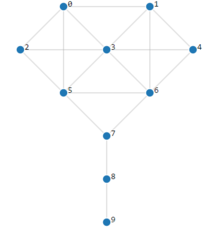
In graph theory, tree is an undirected graph in which any two vertices are connected by exactly one path, or equivalently a connected acyclic undirected graph. A forest is an undirected graph in which any two vertices are connected by at most one path, or equivalently an acyclic undirected graph, or equivalently a disjoint union of trees.

In the mathematical field of graph theory, a bipartite graph is a graph whose vertices can be divided into two disjoint and independent sets and , that is, every edge connects a vertex in to one in . Vertex sets and are usually called the parts of the graph. Equivalently, a bipartite graph is a graph that does not contain any odd-length cycles.
In graph theory and computer science, an adjacency matrix is a square matrix used to represent a finite graph. The elements of the matrix indicate whether pairs of vertices are adjacent or not in the graph.
This is a glossary of graph theory. Graph theory is the study of graphs, systems of nodes or vertices connected in pairs by lines or edges.
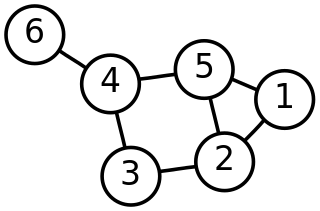
In discrete mathematics, and more specifically in graph theory, a graph is a structure amounting to a set of objects in which some pairs of the objects are in some sense "related". The objects correspond to mathematical abstractions called vertices and each of the related pairs of vertices is called an edge. Typically, a graph is depicted in diagrammatic form as a set of dots or circles for the vertices, joined by lines or curves for the edges. Graphs are one of the objects of study in discrete mathematics.

In graph theory, graph coloring is a special case of graph labeling; it is an assignment of labels traditionally called "colors" to elements of a graph subject to certain constraints. In its simplest form, it is a way of coloring the vertices of a graph such that no two adjacent vertices are of the same color; this is called a vertex coloring. Similarly, an edge coloring assigns a color to each edge so that no two adjacent edges are of the same color, and a face coloring of a planar graph assigns a color to each face or region so that no two faces that share a boundary have the same color.

In the mathematical area of graph theory, a clique is a subset of vertices of an undirected graph such that every two distinct vertices in the clique are adjacent. That is, a clique of a graph is an induced subgraph of that is complete. Cliques are one of the basic concepts of graph theory and are used in many other mathematical problems and constructions on graphs. Cliques have also been studied in computer science: the task of finding whether there is a clique of a given size in a graph is NP-complete, but despite this hardness result, many algorithms for finding cliques have been studied.

In graph theory, an independent set, stable set, coclique or anticlique is a set of vertices in a graph, no two of which are adjacent. That is, it is a set of vertices such that for every two vertices in , there is no edge connecting the two. Equivalently, each edge in the graph has at most one endpoint in . A set is independent if and only if it is a clique in the graph's complement. The size of an independent set is the number of vertices it contains. Independent sets have also been called "internally stable sets", of which "stable set" is a shortening.
In mathematics, spectral graph theory is the study of the properties of a graph in relationship to the characteristic polynomial, eigenvalues, and eigenvectors of matrices associated with the graph, such as its adjacency matrix or Laplacian matrix.

In graph theory, a vertex cover of a graph is a set of vertices that includes at least one endpoint of every edge of the graph.
In discrete mathematics, and more specifically in graph theory, a vertex or node is the fundamental unit of which graphs are formed: an undirected graph consists of a set of vertices and a set of edges, while a directed graph consists of a set of vertices and a set of arcs. In a diagram of a graph, a vertex is usually represented by a circle with a label, and an edge is represented by a line or arrow extending from one vertex to another.
In the mathematical discipline of graph theory, the line graph of an undirected graph G is another graph L(G) that represents the adjacencies between edges of G. L(G) is constructed in the following way: for each edge in G, make a vertex in L(G); for every two edges in G that have a vertex in common, make an edge between their corresponding vertices in L(G).

In graph theory, a proper edge coloring of a graph is an assignment of "colors" to the edges of the graph so that no two incident edges have the same color. For example, the figure to the right shows an edge coloring of a graph by the colors red, blue, and green. Edge colorings are one of several different types of graph coloring. The edge-coloring problem asks whether it is possible to color the edges of a given graph using at most k different colors, for a given value of k, or with the fewest possible colors. The minimum required number of colors for the edges of a given graph is called the chromatic index of the graph. For example, the edges of the graph in the illustration can be colored by three colors but cannot be colored by two colors, so the graph shown has chromatic index three.
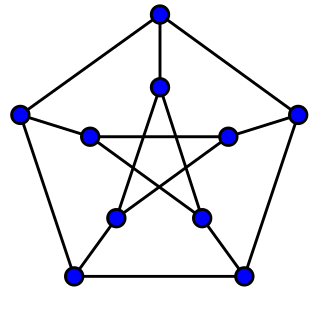
In the mathematical field of graph theory, a cubic graph is a graph in which all vertices have degree three. In other words, a cubic graph is a 3-regular graph. Cubic graphs are also called trivalent graphs.
In the mathematical field of graph theory, the distance between two vertices in a graph is the number of edges in a shortest path connecting them. This is also known as the geodesic distance or shortest-path distance. Notice that there may be more than one shortest path between two vertices. If there is no path connecting the two vertices, i.e., if they belong to different connected components, then conventionally the distance is defined as infinite.

In mathematics, Cayley's formula is a result in graph theory named after Arthur Cayley. It states that for every positive integer , the number of trees on labeled vertices is .

In graph theory and network analysis, indicators of centrality assign numbers or rankings to nodes within a graph corresponding to their network position. Applications include identifying the most influential person(s) in a social network, key infrastructure nodes in the Internet or urban networks, super-spreaders of disease, and brain networks. Centrality concepts were first developed in social network analysis, and many of the terms used to measure centrality reflect their sociological origin.
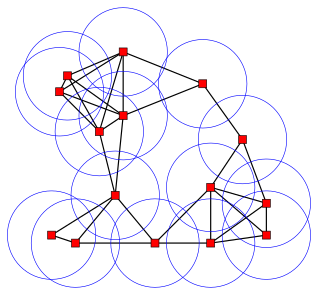
In geometric graph theory, a unit disk graph is the intersection graph of a family of unit disks in the Euclidean plane. That is, it is a graph with one vertex for each disk in the family, and with an edge between two vertices whenever the corresponding vertices lie within a unit distance of each other.
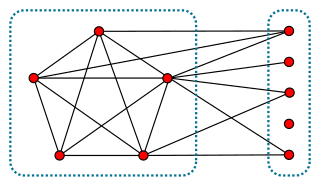
In graph theory, a branch of mathematics, a split graph is a graph in which the vertices can be partitioned into a clique and an independent set. Split graphs were first studied by Földes and Hammer, and independently introduced by Tyshkevich and Chernyak (1979).
David Krackhardt is Professor of Organizations at Heinz College and the Tepper School of Business, with courtesy appointments in the Department of Social and Decision Sciences and the Machine Learning Department, all at Carnegie Mellon University in the United States, and he also serves a Fellow of CEDEP, the European Centre for Executive Education, in France. He is notable for being the author of KrackPlot, a network visualization software designed for social network analysis which is widely used in academic research. He is also the founder of the Journal of Social Structure.