A leak noise correlator is an electronic device used for Leak Detection and as a leak locator to find leaks in pressurized water or gas lines.
Typically, microphones or acoustic sound sensors are placed in contact with the pipe, at two or more points, to record the sound emitted by a leak (e.g. a hissing noise) somewhere between the points. The sound data is processed through a mathematical algorithm which compares or correlates the two recordings to determine the difference in the times it takes noise to travel from the site of the leak to each of the sensors. If the distance between the sensors is known in advance, this timing information can be used to determine the location of the leak., [1] [2]
The cross correlation signal of one continuous function, f, with another, g, is defined as:

where f * denotes the complex conjugate of f.
If f and g are two sound recordings of the noise produced by the leak, delayed in time by a different unknown amount, the time delay can be found by determining the time offset for which the cross correlation product has a maximum value. This approach should be accurate so long as the sound of the leak received at each sensor is sufficiently similar over a period of time.
Leak correlators require accurate information about the materials through which the leak sound is traveling in order to perform an accurate time calculation. The user normally has to input the size and type of pipe as well as the distances of the loggers from each other. Many standard pipe sizes have known speeds of sound which can be used for the calculation. If the materials are unknown, the speed of sound through the materials will have to be calculated on site to get an accurate leak correlation.
Most correlators can also analyze the sound levels and sound frequencies to determine other information about the leak such as the size and severity of the leak or whether it's on the pipe, a valve or hydrant, or in a service line.
Most leak correlators serve two major purposes. First to detect the presence of a leak, second to pinpoint the location of the leak for repair when detected.

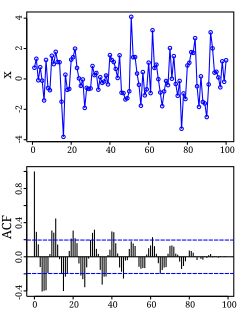
Autocorrelation, sometimes known as serial correlation in the discrete time case, is the correlation of a signal with a delayed copy of itself as a function of delay. Informally, it is the similarity between observations as a function of the time lag between them. The analysis of autocorrelation is a mathematical tool for finding repeating patterns, such as the presence of a periodic signal obscured by noise, or identifying the missing fundamental frequency in a signal implied by its harmonic frequencies. It is often used in signal processing for analyzing functions or series of values, such as time domain signals.

In mathematics, convolution is a mathematical operation on two functions that produces a third function that expresses how the shape of one is modified by the other. The term convolution refers to both the result function and to the process of computing it. It is defined as the integral of the product of the two functions after one is reversed and shifted. The integral is evaluated for all values of shift, producing the convolution function.

The power spectrum of a time series describes the distribution of power into frequency components composing that signal. According to Fourier analysis, any physical signal can be decomposed into a number of discrete frequencies, or a spectrum of frequencies over a continuous range. The statistical average of a certain signal or sort of signal as analyzed in terms of its frequency content, is called its spectrum.
In physics, two wave sources are coherent if their frequency and waveform are identical. Coherence is an ideal property of waves that enables stationary interference. It contains several distinct concepts, which are limiting cases that never quite occur in reality but allow an understanding of the physics of waves, and has become a very important concept in quantum physics. More generally, coherence describes all properties of the correlation between physical quantities of a single wave, or between several waves or wave packets.

In signal processing, cross-correlation is a measure of similarity of two series as a function of the displacement of one relative to the other. This is also known as a sliding dot product or sliding inner-product. It is commonly used for searching a long signal for a shorter, known feature. It has applications in pattern recognition, single particle analysis, electron tomography, averaging, cryptanalysis, and neurophysiology. The cross-correlation is similar in nature to the convolution of two functions. In an autocorrelation, which is the cross-correlation of a signal with itself, there will always be a peak at a lag of zero, and its size will be the signal energy.
Stransform as a time–frequency distribution was developed in 1994 for analyzing geophysics data. In this way, the S transform is a generalization of the short-time Fourier transform (STFT), extending the continuous wavelet transform and overcoming some of its disadvantages. For one, modulation sinusoids are fixed with respect to the time axis; this localizes the scalable Gaussian window dilations and translations in S transform. Moreover, the S transform doesn't have a cross-term problem and yields a better signal clarity than Gabor transform. However, the S transform has its own disadvantages: the clarity is worse than Wigner distribution function and Cohen's class distribution function.
In pulsed radar and sonar signal processing, an ambiguity function is a two-dimensional function of propagation delay and Doppler frequency , . It represents the distortion of a returned pulse due to the receiver matched filter of the return from a moving target. The ambiguity function is defined by the properties of the pulse and of the filter, and not any particular target scenario.

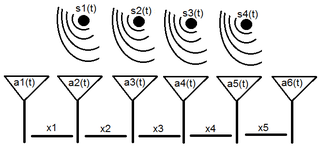
Array processing is a wide area of research in the field of signal processing that extends from the simplest form of 1 dimensional line arrays to 2 and 3 dimensional array geometries. Array structure can be defined as a set of sensors that are spatially separated, e.g. radio antenna and seismic arrays. The sensors used for a specific problem may vary widely, for example microphones, accelerometers and telescopes. However, many similarities exist, the most fundamental of which may be an assumption of wave propagation. Wave propagation means there is a systemic relationship between the signal received on spatially separated sensors. By creating a physical model of the wave propagation, or in machine learning applications a training data set, the relationships between the signals received on spatially separated sensors can be leveraged for many applications.
In physics, the Hanbury Brown and Twiss (HBT) effect is any of a variety of correlation and anti-correlation effects in the intensities received by two detectors from a beam of particles. HBT effects can generally be attributed to the wave–particle duality of the beam, and the results of a given experiment depend on whether the beam is composed of fermions or bosons. Devices which use the effect are commonly called intensity interferometers and were originally used in astronomy, although they are also heavily used in the field of quantum optics.
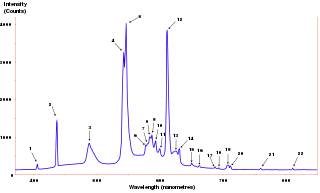
Fluorescence correlation spectroscopy (FCS) is a statistical analysis, via time correlation, of stationary fluctuations of the fluorescence intensity. Its theoretical underpinning originated from L. Onsager's regression hypothesis. The analysis provides kinetic parameters of the physical processes underlying the fluctuations. One of the interesting applications of this is an analysis of the concentration fluctuations of fluorescent particles (molecules) in solution. In this application, the fluorescence emitted from a very tiny space in solution containing a small number of fluorescent particles (molecules) is observed. The fluorescence intensity is fluctuating due to Brownian motion of the particles. In other words, the number of the particles in the sub-space defined by the optical system is randomly changing around the average number. The analysis gives the average number of fluorescent particles and average diffusion time, when the particle is passing through the space. Eventually, both the concentration and size of the particle (molecule) are determined. Both parameters are important in biochemical research, biophysics, and chemistry.

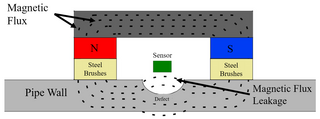
Magnetic flux leakage is a magnetic method of nondestructive testing that is used to detect corrosion and pitting in steel structures, most commonly pipelines and storage tanks. The basic principle is that a powerful magnet is used to magnetize the steel. At areas where there is corrosion or missing metal, the magnetic field "leaks" from the steel. In an MFL tool, a magnetic detector is placed between the poles of the magnet to detect the leakage field. Analysts interpret the chart recording of the leakage field to identify damaged areas and to estimate the depth of metal loss.

Acoustic location is the use of sound to determine the distance and direction of its source or reflector. Location can be done actively or passively, and can take place in gases, liquids, and in solids.

Dynamic light scattering (DLS) is a technique in physics that can be used to determine the size distribution profile of small particles in suspension or polymers in solution. In the scope of DLS, temporal fluctuations are usually analyzed by means of the intensity or photon auto-correlation function. In the time domain analysis, the autocorrelation function (ACF) usually decays starting from zero delay time, and faster dynamics due to smaller particles lead to faster decorrelation of scattered intensity trace. It has been shown that the intensity ACF is the Fourier transformation of the power spectrum, and therefore the DLS measurements can be equally well performed in the spectral domain. DLS can also be used to probe the behavior of complex fluids such as concentrated polymer solutions.

Fluorescence cross-correlation spectroscopy (FCCS) was introduced by Eigen and Rigler in 1994 and experimentally realized by Schwille in 1997. It is essentially an extension of the fluorescence correlation spectroscopy (FCS) procedure by utilizing two differentially colored molecules, instead of one. In other words, coincident green and red intensity fluctuations of distinct molecules correlate if green and red labeled particles are moving together through a predefined confocal volume. As a result, FCCS provides a highly sensitive measurement of molecular interactions independent of diffusion rate. This is an important advancement, given that diffusion rate depends only weakly on the size of the molecular complex.
Radar engineering details are technical details pertaining to the components of a radar and their ability to detect the return energy from moving scatterers — determining an object's position or obstruction in the environment. This includes field of view in terms of solid angle and maximum unambiguous range and velocity, as well as angular, range and velocity resolution. Radar sensors are classified by application, architecture, radar mode, platform, and propagation window.
Pipeline leak detection is used to determine if and in some cases where a leak has occurred in systems which contain liquids and gases. Methods of detection include hydrostatic testing, infrared, and laser technology after pipeline erection and leak detection during service.
3D sound localization refers to an acoustic technology that is used to locate the source of a sound in a three-dimensional space. The source location is usually determined by the direction of the incoming sound waves and the distance between the source and sensors. It involves the structure arrangement design of the sensors and signal processing techniques.
The spectral correlation density (SCD), sometimes also called the cyclic spectral density or spectral correlation function, is a function that describes the cross-spectral density of all pairs of frequency-shifted versions of a time-series. The spectral correlation density applies only to cyclostationary processes because stationary processes do not exhibit spectral correlation. Spectral correlation has been used both in signal detection and signal classification. The spectral correlation density is closely related to each of the bilinear time-frequency distributions, but is not considered one of Cohen's class of distributions.
A seismic array is a system of linked seismometers arranged in a regular geometric pattern to increase sensitivity to earthquake and explosion detection. A seismic array differs from a local network of seismic stations mainly by the techniques used for data analysis. The data from a seismic array is obtained using special digital signal processing techniques such as beamforming, which suppress noises and thus enhance the signal-to-noise ratio (SNR).
The residence time of a fluid parcel is the total time that the parcel has spent inside a control volume. The residence time of a set of parcels is quantified in terms of the frequency distribution of the residence time in the set, which is known as residence time distribution (RTD), or in terms of its average, known as mean residence time.


