A blizzard is a severe snowstorm characterized by strong sustained winds and low visibility, lasting for a prolonged period of time—typically at least three or four hours. A ground blizzard is a weather condition where snow is not falling but loose snow on the ground is lifted and blown by strong winds. Blizzards can have an immense size and usually stretch to hundreds or thousands of kilometres.
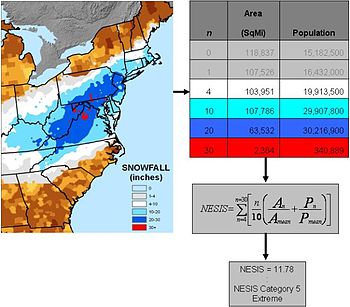
The Northeast Snowfall Impact Scale (NESIS) was created to measure snowstorms in the U.S. Northeast in much the same way the Saffir-Simpson Hurricane Scale records hurricane intensity and the Enhanced Fujita Scale with tornadoes. This scale takes into account the very high population of the Northeast, and thus snowfall amounts are often smaller compared to what other areas of the USA would consider significant snowfall amounts.

The North American blizzard of 2006 was a nor'easter that began on the evening of February 11, 2006. It dumped heavy snow across the Mid-Atlantic and New England states, from Virginia to Maine through the early evening of February 12, and ended in Atlantic Canada on February 13. The major cities from Baltimore to Boston received at least a foot of snow, with a second-highest amount of 26.9 inches (68 cm) in New York City, the most since at least 1869, the start of record keeping, only broken by the January 2016 United States blizzard nearly 10 years later.

The December 2009 North American blizzard was a powerful nor'easter that formed over the Gulf of Mexico in December 2009, and became a major snowstorm that affected the East Coast of the United States and Canadian Atlantic provinces. The snowstorm brought record-breaking December snowfall totals to Washington, D.C., Baltimore, and Philadelphia.

The 2009 North American Christmas blizzard was a powerful winter storm and severe weather event that affected the Midwestern United States, Great Plains, Southeastern United States, the Eastern Seaboard, and parts of Ontario. The storm began to develop on December 22 before intensifying to produce extreme winds and precipitation by the morning of December 24. The storm's rapid development made it difficult for forecasters to predict. The blizzard was reported to have claimed at least 21 lives, and disrupted air travel during the Christmas travel season. In the Southeastern and Central United States, an outbreak of 28 tornadoes occurred between December 23–24. The storm, a Category 5 "Extreme" one on the Regional Snowfall Index scale, was the first winter weather event to rank as such since the North American blizzard of 1996.

The December 2000 nor'easter was a significant winter storm that impacted the Mid-Atlantic and New England regions of the United States around the end of the month. It began as an Alberta clipper that moved southeastward through the central United States and weakened over the Ohio Valley. However, it redeveloped off the coast of North Carolina and moved northward as it intensified. It moved into central Long Island and eventually tracked northward into New England. The storm dropped heavy precipitation throughout the Northeast, especially in northern New Jersey and eastern New York, where snowfall often exceeded 2 ft (0.61 m). Even so, as it struck on a weekend, its effects were generally minor and mostly limited to travel delays, traffic accidents, and business closures.
The February 1995 nor'easter was a significant nor'easter that impacted the Mid-Atlantic and New England regions of the United States around the beginning of the month. It was the only major nor'easter of the 1994–1995 winter.
The February 1987 nor'easter was a significant winter storm in the US that impacted the Mid-Atlantic States around the end of the month. It delivered 8–12 hours of heavy, wet snowfall to several states from West Virginia to New York between February 22 and February 24. The storm was both preceded and followed by relatively warm temperatures, causing the snow to rapidly melt. The mild conditions were the result of a moderate anticyclone over the region that deteriorated as the nor'easter approached. Cold air damming likely took place prior to the storm's formation.

The February 1969 nor'easter was a severe winter storm that affected the Mid-Atlantic and New England regions of the United States between February 8 and February 10. The nor'easter dropped paralyzing snowfall, exceeding 20 in (51 cm) in many places. New York City bore the brunt of the storm, suffering extensive disruption. Thousands of travelers became stranded on roads and in airports. The storm killed at least 94 people. City schools were closed for several days and some areas of the city remained uncleared for over a week. New York Mayor John Lindsay was criticized for failing to respond to the snowstorm adequately.

The March 18–20, 1956 nor'easter was a significant winter storm in the United States that affected the Mid-Atlantic States and southern New England. The storm ranked as Category 1, or "notable", on the Northeast Snowfall Impact Scale. A high-pressure area north of New York State, developing in the wake of another system on March 15–16, provided cold air for the snowfall. It was among a series of snowstorms to affect the region during the month.

The March 18–22, 1958 nor'easter was an unusual late-season and violent winter storm that impacted the Mid-Atlantic and New England regions of the United States. Its snowfall extended from North Carolina through Maine.

The February 1952 nor'easter was a significant winter storm that impacted the New England region of the United States. The storm ranked as Category 1, or "notable", on the Northeast Snowfall Impact Scale. Its rapid intensification resulted in heavy snowfall between February 17 and 18, accumulating to 12 to 30 inches. High winds also affected central and northern New England. The nor'easter is estimated to have caused 42 fatalities. In Maine, over 1,000 travelers became stranded on roadways. Two ships cracked in two offshore New England during the storm.
Paul Kocin is a meteorologist and winter weather expert. He grew up on Long Island, New York and received his B.S. from Cornell University, followed by his M.Sc. from Pennsylvania State University. After graduation, he briefly worked for NASA as a contractor then was hired by the US National Weather Service at the Hydrometeorological Prediction Center in 1989. Kocin worked as an on-air personality with The Weather Channel from 1998 to 2006. He returned to NOAA afterward, first as a surface weather analyst and then to the medium range desk, forecasting weather for Alaska up to eight days in advance.

The January 1961 nor'easter was a significant winter storm that impacted the Mid-Atlantic and New England regions of the United States. It was the second of three major snowstorms during the 1960–1961 winter. The storm ranked as Category 3, or "major", on the Northeast Snowfall Impact Scale.

The December 1960 nor'easter was a significant early-season winter storm that impacted the Mid-Atlantic and New England regions of the United States. Moderate to heavy snowfall fell from West Virginia to eastern Maine, amounting to 10 in (25 cm) or more in parts of 13 states and peaking at 21.4 in (54 cm) at Newark, New Jersey. The storm was accompanied by strong winds, gusting to over 90 mph (140 km/h) in coastal New England, and left in its wake a dangerously cold air mass. The storm originated in a weak low pressure area which formed over the western Gulf of Mexico on December 10. A secondary low developed over South Carolina on the next day, supported by the merger of two troughs aloft. Sliding southeast of New England, the new storm explosively deepened to become a full-fledged nor'easter, with a minimum central air pressure of 966 mbar. It began to weaken over the Canadian Maritimes.

The March 1960 nor'easter was a severe winter storm that impacted the Mid-Atlantic and New England regions of the United States. The storm ranked as Category 4, or "crippling", on the Northeast Snowfall Impact Scale. Northeasterly flow, combined with the storm's slower forward motion, enhanced snowfall across the region. The cyclone began moving away from the United States on March 5. It took place during a stormy period in the affected region, contributing to record snowfall.

The December 1969 nor'easter was a strong winter storm that mainly affected the Northeastern United States and southern Quebec between December 25 and December 28, 1969. The multi-faceted storm system included a tornado outbreak, record snow accumulations, a damaging ice storm, and flooding rains.
The Regional Snowfall Index (RSI) is a scale used by NOAA to assess the societal impact of winter storms in the eastern two-thirds of the United States and classify them into one of six categories. The system was first implemented in 2014, and is a replacement for the Northeast Snowfall Impact Scale (NESIS) system which the National Climatic Data Center (NCDC) began using in 2005. The NCDC has retroactively assigned RSI values to almost 600 historical storms that have occurred since 1900.