Biostatistics is a branch of statistics that applies statistical methods to a wide range of topics in biology. It encompasses the design of biological experiments, the collection and analysis of data from those experiments and the interpretation of the results.

A logarithmic scale is a method used to display numerical data that spans a broad range of values, especially when there are significant differences between the magnitudes of the numbers involved.

A bar chart or bar graph is a chart or graph that presents categorical data with rectangular bars with heights or lengths proportional to the values that they represent. The bars can be plotted vertically or horizontally. A vertical bar chart is sometimes called a column chart.

A scatter plot, also called a scatterplot, scatter graph, scatter chart, scattergram, or scatter diagram, is a type of plot or mathematical diagram using Cartesian coordinates to display values for typically two variables for a set of data. If the points are coded (color/shape/size), one additional variable can be displayed. The data are displayed as a collection of points, each having the value of one variable determining the position on the horizontal axis and the value of the other variable determining the position on the vertical axis.
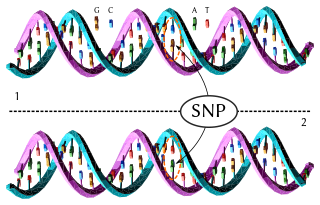
In genetics and bioinformatics, a single-nucleotide polymorphism is a germline substitution of a single nucleotide at a specific position in the genome. Although certain definitions require the substitution to be present in a sufficiently large fraction of the population, many publications do not apply such a frequency threshold.
In population genetics, linkage disequilibrium (LD) is a measure of non-random association between segments of DNA (alleles) at different positions on the chromosome (loci) in a given population based on a comparison between the frequency at which two alleles are detected together at the same loci and the frequencies at which each allele is detected at that loci overall, whether it occurs with or without the other allele of interest. Loci are said to be in linkage disequilibrium when the frequency of being detected together is higher or lower than expected if the loci were independent and associated randomly.
A stem-and-leaf display or stem-and-leaf plot is a device for presenting quantitative data in a graphical format, similar to a histogram, to assist in visualizing the shape of a distribution. They evolved from Arthur Bowley's work in the early 1900s, and are useful tools in exploratory data analysis. Stemplots became more commonly used in the 1980s after the publication of John Tukey's book on exploratory data analysis in 1977. The popularity during those years is attributable to their use of monospaced (typewriter) typestyles that allowed computer technology of the time to easily produce the graphics. Modern computers' superior graphic capabilities have meant these techniques are less often used.

In science and engineering, a semi-log plot/graph or semi-logarithmicplot/graph has one axis on a logarithmic scale, the other on a linear scale. It is useful for data with exponential relationships, where one variable covers a large range of values.
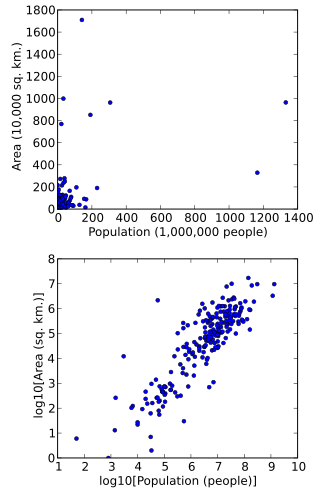
In statistics, data transformation is the application of a deterministic mathematical function to each point in a data set—that is, each data point zi is replaced with the transformed value yi = f(zi), where f is a function. Transforms are usually applied so that the data appear to more closely meet the assumptions of a statistical inference procedure that is to be applied, or to improve the interpretability or appearance of graphs.

In genomics, a genome-wide association study, is an observational study of a genome-wide set of genetic variants in different individuals to see if any variant is associated with a trait. GWA studies typically focus on associations between single-nucleotide polymorphisms (SNPs) and traits like major human diseases, but can equally be applied to any other genetic variants and any other organisms.

A plot is a graphical technique for representing a data set, usually as a graph showing the relationship between two or more variables. The plot can be drawn by hand or by a computer. In the past, sometimes mechanical or electronic plotters were used. Graphs are a visual representation of the relationship between variables, which are very useful for humans who can then quickly derive an understanding which may not have come from lists of values. Given a scale or ruler, graphs can also be used to read off the value of an unknown variable plotted as a function of a known one, but this can also be done with data presented in tabular form. Graphs of functions are used in mathematics, sciences, engineering, technology, finance, and other areas.
Relative species abundance is a component of biodiversity and is a measure of how common or rare a species is relative to other species in a defined location or community. Relative abundance is the percent composition of an organism of a particular kind relative to the total number of organisms in the area. Relative species abundances tend to conform to specific patterns that are among the best-known and most-studied patterns in macroecology. Different populations in a community exist in relative proportions; this idea is known as relative abundance.
WGAViewer is a bioinformatics software tool which is designed to visualize, annotate, and help interpret the results generated from a genome wide association study (GWAS). Alongside the P values of association, WGAViewer allows a researcher to visualize and consider other supporting evidence, such as the genomic context of the SNP, linkage disequilibrium (LD) with ungenotyped SNPs, gene expression database, and the evidence from other GWAS projects, when determining the potential importance of an individual SNP.
Fold change is a measure describing how much a quantity changes between an original and a subsequent measurement. It is defined as the ratio between the two quantities; for quantities A and B the fold change of B with respect to A is B/A. In other words, a change from 30 to 60 is defined as a fold-change of 2. This is also referred to as a "one fold increase". Similarly, a change from 30 to 15 is referred to as a "0.5-fold decrease". Fold change is often used when analysing multiple measurements of a biological system taken at different times as the change described by the ratio between the time points is easier to interpret than the difference.

In statistics, a volcano plot is a type of scatter-plot that is used to quickly identify changes in large data sets composed of replicate data. It plots significance versus fold-change on the y and x axes, respectively. These plots are increasingly common in omic experiments such as genomics, proteomics, and metabolomics where one often has a list of many thousands of replicate data points between two conditions and one wishes to quickly identify the most meaningful changes. A volcano plot combines a measure of statistical significance from a statistical test with the magnitude of the change, enabling quick visual identification of those data-points that display large magnitude changes that are also statistically significant.
The missing heritability problem refers to the difference between heritability estimates from genetic data and heritability estimates from twin and family data across many physical and mental traits, including diseases, behaviors, and other phenotypes. This is a problem that has significant implications for medicine, since a person's susceptibility to disease may depend more on the combined effect of all the genes in the background than on the disease genes in the foreground, or the role of genes may have been severely overestimated.
Genome-wide complex trait analysis (GCTA) Genome-based restricted maximum likelihood (GREML) is a statistical method for heritability estimation in genetics, which quantifies the total additive contribution of a set of genetic variants to a trait. GCTA is typically applied to common single nucleotide polymorphisms (SNPs) on a genotyping array and thus termed "chip" or "SNP" heritability.

Complex traits are phenotypes that are controlled by two or more genes and do not follow Mendel’s Law of Dominance. They may have a range of expression which is typically continuous. Both environmental and genetic factors often impact the variation in expression. Human height is a continuous trait meaning that there is a wide range of heights. There are an estimated 50 genes that affect the height of a human. Environmental factors, like nutrition, also play a role in a human’s height. Other examples of complex traits include: crop yield, plant color, and many diseases including diabetes and Parkinson's disease. One major goal of genetic research today is to better understand the molecular mechanisms through which genetic variants act to influence complex traits. Complex Traits are also known as polygenic traits and multigenic traits.
The GWAS catalog is a free online database that compiles data of genome-wide association studies (GWAS), summarizing unstructured data from different literature sources into accessible high quality data. It was created by the National Human Genome Research Institute (NHGRI) in 2008 and have become a collaborative project between the NHGRI and the European Bioinformatics Institute (EBI) since 2010. As of September 2018, it has included 71,673 SNP–trait associations in 3,567 publications.
Transcriptome-wide association study (TWAS) is a genetic methodology that can be used to compare the genetic components of gene expression and the genetic components of a trait to determine if an association is present between the two components. TWAS are useful for the identification and prioritization of candidate causal genes in candidate gene analysis following genome-wide association studies. TWAS looks at the RNA products of a specific tissue and gives researchers the abilities to look at the genes being expressed as well as gene expression levels, which varies by tissue type. TWAS are valuable and flexible bioinformatics tools that looks at the associations between the expressions of genes and complex traits and diseases. By looking at the association between gene expression and the trait expressed, genetic regulatory mechanisms can be investigated for the role that they play in the development of specific traits and diseases.
