Map coloring

Last updated
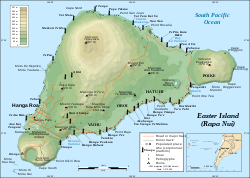
Topographic map of Easter Island using colors to show elevations. Easter Island map-en.svg
Topographic map of Easter Island using colors to show elevations.

In cartographic design, map coloring is the act of choosing colors as a form of map symbol to be used on a map.

Color is a very useful attribute to depict different features on a map. [1] Typical uses of color include displaying different political divisions, different elevations, or different kinds of roads. A choropleth map is a thematic map in which areas are colored differently to show the measurement of a statistical variable being displayed on the map. The choropleth map provides an easy way to visualize how a measurement varies across a geographic area or it shows the level of variability within a region. In addition to choropleth maps, a cartographer should strive to depict colors effectively on any kind of map.

Displaying the data in different hues can greatly affect the understanding or feel of the map. [2] In many cultures, certain colors have connotations. These connotations lie under a field of study called color symbolism. For example, coloring a certain nation a color that has a negative connotation in their culture could be counterproductive. Likewise, using assumed skin colors to show racial or ethnic patterns will likely cause offense. It is not possible to always predict the color connotations of every map reader or to avoid negative connotations, but it is helpful to be aware of common color connotations in order to make a map as appealing and understandable as possible. [3]

Cartographers may also choose to pick hues that are associated with what they are mapping. For example, when mapping precipitation, they may choose to use shades of blue or for a map of wildfires they may use yellows, reds, and oranges. Carefully choosing colors ensures that the map is intuitive and easy to read. [4] This process is referred to as feature association. Also, the cartographer must take into account that many people have impaired color vision, and colors must be used that are easily distinguishable by such readers. [5]

A general rule is that most people can differentiate only between 5-8 different shades of one color. Rather than more than 8 shades of a color, it is best to use multiple colors. Most GIS programs provide users with carefully curated color schemes to choose from, thus making the process of selecting colors easier.

Colors can also be used to produce three-dimensional effects from two-dimensional maps, either by explicit color-coding of the two images intended for different eyes, or by using the characteristics of the human visual system to make the map look three-dimensional. [6]

The 2004 United States presidential election visualised using a choropleth map 2004US election map.svg
The 2004 United States presidential election visualised using a choropleth map

See also

Related Research Articles

<span class="mw-page-title-main">Cartography</span> Study and practice of making maps

Cartography is the study and practice of making and using maps. Combining science, aesthetics and technique, cartography builds on the premise that reality can be modeled in ways that communicate spatial information effectively.

<span class="mw-page-title-main">Map</span> Symbolic depiction of relationships

A map is a symbolic depiction emphasizing relationships between elements of some space, such as objects, regions, or themes.

<span class="mw-page-title-main">World map</span> Map of most or all of the surface of the Earth

A world map is a map of most or all of the surface of Earth. World maps, because of their scale, must deal with the problem of projection. Maps rendered in two dimensions by necessity distort the display of the three-dimensional surface of the Earth. While this is true of any map, these distortions reach extremes in a world map. Many techniques have been developed to present world maps that address diverse technical and aesthetic goals.

<span class="mw-page-title-main">False color</span> Methods of visualizing information by translating to colors

False color refers to a group of color rendering methods used to display images in color which were recorded in the visible or non-visible parts of the electromagnetic spectrum. A false-color image is an image that depicts an object in colors that differ from those a photograph would show. In this image, colors have been assigned to three different wavelengths that human eyes cannot normally see.

<span class="mw-page-title-main">Choropleth map</span> Type of data visualization for geographic regions

A choropleth map is a type of statistical thematic map that uses pseudocolor, meaning color corresponding with an aggregate summary of a geographic characteristic within spatial enumeration units, such as population density or per-capita income.

In color theory, a color scheme is a combination of 2 or more colors used in aesthetic or practical design. Aesthetic color schemes are used to create style and appeal. Colors that create a harmonious feeling when viewed together are often used together in aesthetic color schemes. Practical color schemes are used to inhibit or facilitate color tasks, such as camouflage color schemes or high visibility color schemes. Qualitative and quantitative color schemes are used to encode unordered categorical data and ordered data, respectively. Color schemes are often described in terms of logical combinations of colors on a color wheel or within a color space.

<span class="mw-page-title-main">Heat map</span> Data visualization technique

A heat map is a 2-dimensional data visualization technique that represents the magnitude of individual values within a dataset as a color. The variation in color may be by hue or intensity.

<span class="mw-page-title-main">Thematic map</span> Type of map that visualizes data

A thematic map is a type of map that portrays the geographic pattern of a particular subject matter (theme) in a geographic area. This usually involves the use of map symbols to visualize selected properties of geographic features that are not naturally visible, such as temperature, language, or population. In this, they contrast with general reference maps, which focus on the location of a diverse set of physical features, such as rivers, roads, and buildings. Alternative names have been suggested for this class, such as special-subject or special-purpose maps, statistical maps, or distribution maps, but these have generally fallen out of common usage. Thematic mapping is closely allied with the field of Geovisualization.

<span class="mw-page-title-main">Terrain cartography</span> Representation of surface shape on maps

Terrain cartography or relief mapping is the depiction of the shape of the surface of the Earth on a map, using one or more of several techniques that have been developed. Terrain or relief is an essential aspect of physical geography, and as such its portrayal presents a central problem in cartographic design, and more recently geographic information systems and geovisualization.

<span class="mw-page-title-main">Hypsometric tints</span> Use of color to mark elevation in a map

Hypsometric tints are colors placed between contour lines to indicate elevation. These tints are shown as bands of color in a graduated scheme or as a color scheme applied to contour lines themselves; either method is considered a type of Isarithmic map. Hypsometric tinting of maps and globes is often accompanied by a similar method of bathymetric tinting to convey differences in water depth. 

<span class="mw-page-title-main">Multivariate map</span> Thematic map visualizing multiple variables

A bivariate map or multivariate map is a type of thematic map that displays two or more variables on a single map by combining different sets of symbols. Each of the variables is represented using a standard thematic map technique, such as choropleth, cartogram, or proportional symbols. They may be the same type or different types, and they may be on separate layers of the map, or they may be combined into a single multivariate symbol.

Borden D. Dent (1938–2000) was an American geographer and cartographer who served as professor emeritus and chairman of the Department of Geography and Anthropology at Georgia State University. His textbook, Cartography: Thematic Map Design, is one of the seminal texts in the field, and its sixth edition was reissued in 2009.

The Jenks optimization method, also called the Jenks natural breaks classification method, is a data clustering method designed to determine the best arrangement of values into different classes. This is done by seeking to minimize each class's average deviation from the class mean, while maximizing each class's deviation from the means of the other classes. In other words, the method seeks to reduce the variance within classes and maximize the variance between classes.

<span class="mw-page-title-main">Map symbol</span> Graphic depiction of a geographic phenomenon

A map symbol or cartographic symbol is a graphical device used to visually represent a real-world feature on a map, working in the same fashion as other forms of symbols. Map symbols may include point markers, lines, regions, continuous fields, or text; these can be designed visually in their shape, size, color, pattern, and other graphic variables to represent a variety of information about each phenomenon being represented.

Cynthia Ann Brewer is an American cartographer, author, and professor of geography at Pennsylvania State University. Brewer's specialty relates to visibility and color theory in cartography and, in 2023, she was awarded the International Cartographic Society's highest honor, the Carl Mannerfelt Gold Medal, for her distinguished contribution to the field.

<span class="mw-page-title-main">ColorBrewer</span> Online color tool for cartography

ColorBrewer is an online tool for selecting map color schemes based on color palettes invented by Cynthia Brewer. It was launched in 2002 and is licensed using Apache 2.0 software license, which is similar to CC-BY-SA 3.0. Suggested color schemes are based on the data type, such as sequential, diverging, or qualitative.

<span class="mw-page-title-main">Chorochromatic map</span> Thematic map visualizing a discrete field

A Chorochromatic map, also known as an area-class, qualitative area, or mosaic map, is a type of thematic map that portray regions of categorical or nominal data using variations in color symbols. Chorochromatic maps are typically used to represent discrete fields, also known as categorical coverages. Chorochromatic maps differ from choropleth maps in that chorochromatic maps are mapped according to data-driven boundaries instead of trying to make the data fit within existing, sometimes arbitrary units such as political boundaries.

A visual variable, in cartographic design, graphic design, and data visualization, is an aspect of a graphical object that can visually differentiate it from other objects, and can be controlled during the design process. The concept was first systematized by Jacques Bertin, a French cartographer and graphic designer, and published in his 1967 book, Sémiologie Graphique. Bertin identified a basic set of these variables and provided guidance for their usage; the concept and the set of variables has since been expanded, especially in cartography, where it has become a core principle of education and practice.

<span class="mw-page-title-main">Cartographic design</span> Process of designing maps

Cartographic design or map design is the process of crafting the appearance of a map, applying the principles of design and knowledge of how maps are used to create a map that has both aesthetic appeal and practical function. It shares this dual goal with almost all forms of design; it also shares with other design, especially graphic design, the three skill sets of artistic talent, scientific reasoning, and technology. As a discipline, it integrates design, geography, and geographic information science.

<span class="mw-page-title-main">Proportional symbol map</span> Thematic map based on symbol size

A proportional symbol map or proportional point symbol map is a type of thematic map that uses map symbols that vary in size to represent a quantitative variable. For example, circles may be used to show the location of cities within the map, with the size of each circle sized proportionally to the population of the city. Typically, the size of each symbol is calculated so that its area is mathematically proportional to the variable, but more indirect methods are also used.

References

  1. Matt Rosenberg. "Map Colors - The Role of Colors on Maps".
  2. Robinson, A.H. (1967). "Psychological aspects of color in cartography". International Yearbook of Cartography. 7: 50–61.
  3. Tyner, Judith (2010). Principles of Map Design. Guilford Press. pp. 64–65.
  4. Lin, Sharon (2014). "The right colors makes data easier to read". Harvard Business Review.
  5. Brewer, C. (1996). "Guidelines for selecting colors for diverging schemes on maps". The Cartographic Journal. Maney Publishing. 33 (2): 79–86. Bibcode:1996CartJ..33...79B. doi:10.1179/caj.1996.33.2.79.
  6. Eyton, J.R. (1990). "Color stereoscopic effect cartography". Cartographica. UT Press. 27 (1): 20–29. doi: 10.3138/K213-2288-7672-U72T .