
The unified modeling language (UML) is a general-purpose modeling language that is intended to provide a standard way to visualize the design of a system.
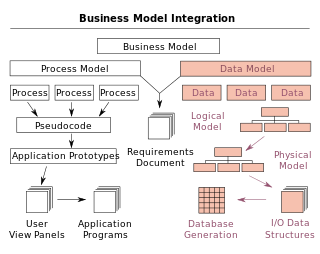
A data model is an abstract model that organizes elements of data and standardizes how they relate to one another and to the properties of real-world entities. For instance, a data model may specify that the data element representing a car be composed of a number of other elements which, in turn, represent the color and size of the car and define its owner.
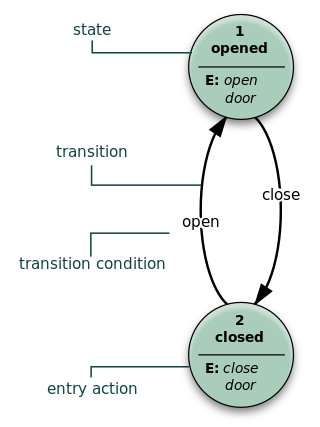
A state diagram is a type of diagram used in computer science and related fields to describe the behavior of systems. State diagrams require that the system described is composed of a finite number of states; sometimes, this is indeed the case, while at other times this is a reasonable abstraction. Many forms of state diagrams exist, which differ slightly and have different semantics.
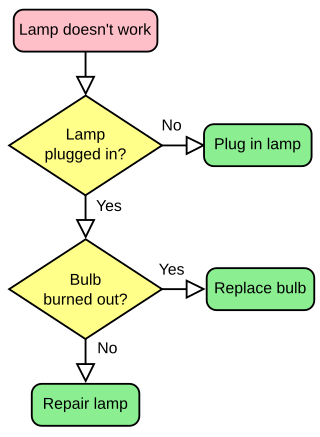
A flowchart is a type of diagram that represents a workflow or process. A flowchart can also be defined as a diagrammatic representation of an algorithm, a step-by-step approach to solving a task.

An entity–relationship model describes interrelated things of interest in a specific domain of knowledge. A basic ER model is composed of entity types and specifies relationships that can exist between entities.

Ivar Hjalmar Jacobson is a Swedish computer scientist and software engineer, known as major contributor to UML, Objectory, Rational Unified Process (RUP), aspect-oriented software development and Essence.
A data-flow diagram is a way of representing a flow of data through a process or a system. The DFD also provides information about the outputs and inputs of each entity and the process itself. A data-flow diagram has no control flow — there are no decision rules and no loops. Specific operations based on the data can be represented by a flowchart.
A stereotype is one of three types of extensibility mechanisms in the Unified Modeling Language (UML), the other two being tags and constraints. They allow designers to extend the vocabulary of UML in order to create new model elements, derived from existing ones, but that have specific properties that are suitable for a particular domain or otherwise specialized usage. The nomenclature is derived from the original meaning of stereotype, used in printing. For example, when modeling a network you might need to have symbols for representing routers and hubs. By using stereotyped nodes you can make these things appear as primitive building blocks.

Object process methodology (OPM) is a conceptual modeling language and methodology for capturing knowledge and designing systems, specified as ISO/PAS 19450. Based on a minimal universal ontology of stateful objects and processes that transform them, OPM can be used to formally specify the function, structure, and behavior of artificial and natural systems in a large variety of domains.

A sequence diagram or system sequence diagram (SSD) shows process interactions arranged in time sequence in the field of software engineering. It depicts the processes and objects involved and the sequence of messages exchanged between the processes and objects needed to carry out the functionality. Sequence diagrams are typically associated with use case realizations in the 4+1 architectural view model of the system under development. Sequence diagrams are sometimes called event diagrams or event scenarios.
A UML tool is a software application that supports some or all of the notation and semantics associated with the Unified Modeling Language (UML), which is the industry standard general-purpose modeling language for software engineering.
Specification and Description Language (SDL) is a specification language targeted at the unambiguous specification and description of the behaviour of reactive and distributed systems.

In software engineering, a class diagram in the Unified Modeling Language (UML) is a type of static structure diagram that describes the structure of a system by showing the system's classes, their attributes, operations, and the relationships among objects.

Business Process Model and Notation (BPMN) is a graphical representation for specifying business processes in a business process model.

Activity diagrams are graphical representations of workflows of stepwise activities and actions with support for choice, iteration and concurrency. In the Unified Modeling Language, activity diagrams are intended to model both computational and organizational processes, as well as the data flows intersecting with the related activities. Although activity diagrams primarily show the overall flow of control, they can also include elements showing the flow of data between activities through one or more data stores.
Glossary of Unified Modeling Language (UML) terms provides a compilation of terminology used in all versions of UML, along with their definitions. Any notable distinctions that may exist between versions are noted with the individual entry it applies to.
Object-oriented design (OOD) is the process of planning a system of interacting objects for the purpose of solving a software problem. It is one approach to software design.

In object-oriented programming, an object diagram in the Unified Modeling Language (UML) is a diagram that shows a complete or partial view of the structure of a modeled system at a specific time.
UML state machine, also known as UML statechart, is an extension of the mathematical concept of a finite automaton in computer science applications as expressed in the Unified Modeling Language (UML) notation.
PragmaDev Studio is a modeling and testing software tool introduced by PragmaDev in 2002 dedicated to the specification of communicating systems. It was initially called Real Time Developer Studio or RTDS. Its primary objective was to support SDL-RT modeling technology. Since V5.0 launched on October 7, 2015 RTDS is called PragmaDev Studio, and it is organized in four independent modules: Specifier, Developer, Tester and Tracer. V5.1 launched on November 29, 2016 introduces a freemium licensing model.


