In microeconomics, economies of scale are the cost advantages that enterprises obtain due to their scale of operation, and are typically measured by the amount of output produced per unit of time. A decrease in cost per unit of output enables an increase in scale that is, increased production with lowered cost. At the basis of economies of scale, there may be technical, statistical, organizational or related factors to the degree of market control.
A monopoly, as described by Irving Fisher, is a market with the "absence of competition", creating a situation where a specific person or enterprise is the only supplier of a particular thing. This contrasts with a monopsony which relates to a single entity's control of a market to purchase a good or service, and with oligopoly and duopoly which consists of a few sellers dominating a market. Monopolies are thus characterised by a lack of economic competition to produce the good or service, a lack of viable substitute goods, and the possibility of a high monopoly price well above the seller's marginal cost that leads to a high monopoly profit. The verb monopolise or monopolize refers to the process by which a company gains the ability to raise prices or exclude competitors. In economics, a monopoly is a single seller. In law, a monopoly is a business entity that has significant market power, that is, the power to charge overly high prices, which is associated with unfair price raises. Although monopolies may be big businesses, size is not a characteristic of a monopoly. A small business may still have the power to raise prices in a small industry.
In economics, specifically general equilibrium theory, a perfect market, also known as an atomistic market, is defined by several idealizing conditions, collectively called perfect competition, or atomistic competition. In theoretical models where conditions of perfect competition hold, it has been demonstrated that a market will reach an equilibrium in which the quantity supplied for every product or service, including labor, equals the quantity demanded at the current price. This equilibrium would be a Pareto optimum.

In economics, profit maximization is the short run or long run process by which a firm may determine the price, input and output levels that will lead to the highest possible total profit. In neoclassical economics, which is currently the mainstream approach to microeconomics, the firm is assumed to be a "rational agent" which wants to maximize its total profit, which is the difference between its total revenue and its total cost.
A good's price elasticity of demand is a measure of how sensitive the quantity demanded is to its price. When the price rises, quantity demanded falls for almost any good, but it falls more for some than for others. The price elasticity gives the percentage change in quantity demanded when there is a one percent increase in price, holding everything else constant. If the elasticity is −2, that means a one percent price rise leads to a two percent decline in quantity demanded. Other elasticities measure how the quantity demanded changes with other variables.
Economies of scope are "efficiencies formed by variety, not volume". In economics, "economies" is synonymous with cost savings and "scope" is synonymous with broadening production/services through diversified products. Economies of scope is an economic theory stating that average total cost of production decrease as a result of increasing the number of different goods produced. For example, a gas station that sells gasoline can sell soda, milk, baked goods, etc. through their customer service representatives and thus gasoline companies achieve economies of scope. The business historian Alfred Chandler argued that economies of scope contributed to the rise of American business corporations during the 20th century.
In economics, the marginal cost is the change in the total cost that arises when the quantity produced is increased, i.e. the cost of producing additional quantity. In some contexts, it refers to an increment of one unit of output, and in others it refers to the rate of change of total cost as output is increased by an infinitesimal amount. As Figure 1 shows, the marginal cost is measured in dollars per unit, whereas total cost is in dollars, and the marginal cost is the slope of the total cost, the rate at which it increases with output. Marginal cost is different from average cost, which is the total cost divided by the number of units produced.
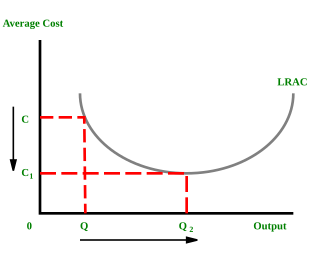
In economics, average cost (AC) or unit cost is equal to total cost (TC) divided by the number of units of a good produced :

In economics and in particular neoclassical economics, the marginal product or marginal physical productivity of an input is the change in output resulting from employing one more unit of a particular input, assuming that the quantities of other inputs are kept constant.
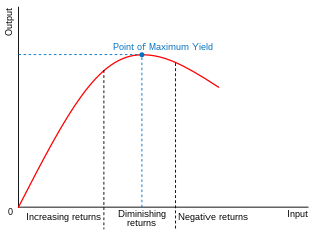
In economics, diminishing returns are the decrease in marginal (incremental) output of a production process as the amount of a single factor of production is incrementally increased, holding all other factors of production equal. The law of diminishing returns states that in productive processes, increasing a factor of production by one unit, while holding all other production factors constant, will at some point return a lower unit of output per incremental unit of input. The law of diminishing returns does not cause a decrease in overall production capabilities, rather it defines a point on a production curve whereby producing an additional unit of output will result in a loss and is known as negative returns. Under diminishing returns, output remains positive, but productivity and efficiency decrease.
In economics, the concept of returns to scale arises in the context of a firm's production function. It explains the long-run linkage of increase in output (production) relative to associated increases in the inputs.

Marginal revenue is a central concept in microeconomics that describes the additional total revenue generated by increasing product sales by 1 unit. Marginal revenue is the increase in revenue from the sale of one additional unit of product, i.e., the revenue from the sale of the last unit of product. It can be positive or negative. Marginal revenue is an important concept in vendor analysis. To derive the value of marginal revenue, it is required to examine the difference between the aggregate benefits a firm received from the quantity of a good and service produced last period and the current period with one extra unit increase in the rate of production. Marginal revenue is a fundamental tool for economic decision making within a firm's setting, together with marginal cost to be considered.
The marginal revenue productivity theory of wages is a model of wage levels in which they set to match to the marginal revenue product of labor, , which is the increment to revenues caused by the increment to output produced by the last laborer employed. In a model, this is justified by an assumption that the firm is profit-maximizing and thus would employ labor only up to the point that marginal labor costs equal the marginal revenue generated for the firm. This is a model of the neoclassical economics type.
The Lerner index, formalized in 1934 by British economist of Russian origin Abba Lerner, is a measure of a firm's market power.
In economics, a cost curve is a graph of the costs of production as a function of total quantity produced. In a free market economy, productively efficient firms optimize their production process by minimizing cost consistent with each possible level of production, and the result is a cost curve. Profit-maximizing firms use cost curves to decide output quantities. There are various types of cost curves, all related to each other, including total and average cost curves; marginal cost curves, which are equal to the differential of the total cost curves; and variable cost curves. Some are applicable to the short run, others to the long run.
In economics, supply is the amount of a resource that firms, producers, labourers, providers of financial assets, or other economic agents are willing and able to provide to the marketplace or to an individual. Supply can be in produced goods, labour time, raw materials, or any other scarce or valuable object. Supply is often plotted graphically as a supply curve, with the price per unit on the vertical axis and quantity supplied as a function of price on the horizontal axis. This reversal of the usual position of the dependent variable and the independent variable is an unfortunate but standard convention.
In economics, the marginal product of labor (MPL) is the change in output that results from employing an added unit of labor. It is a feature of the production function and depends on the amounts of physical capital and labor already in use.

The socially optimal firm size is the size for a company in a given industry at a given time which results in the lowest production costs per unit of output.
A Robinson Crusoe economy is a simple framework used to study some fundamental issues in economics. It assumes an economy with one consumer, one producer and two goods. The title "Robinson Crusoe" is a reference to the 1719 novel of the same name authored by Daniel Defoe.

In microeconomics, a monopoly price is set by a monopoly. A monopoly occurs when a firm lacks any viable competition and is the sole producer of the industry's product. Because a monopoly faces no competition, it has absolute market power and can set a price above the firm's marginal cost.


