
Color or colour is the visual perception based on the electromagnetic spectrum. Though color is not an inherent property of matter, color perception is related to an object's light absorption, reflection, emission spectra and interference. For most humans, color are perceived in the visible light spectrum with three types of cone cells (trichromacy). Other animals may have a different number of cone cell types or have eyes sensitive to different wavelength, such as bees that can distinguish ultraviolet, and thus have a different color sensitivity range. Animal perception of color originates from different light wavelength or spectral sensitivity in cone cell types, which is then processed by the brain.

Spectroscopy is the field of study that measures and interprets the electromagnetic spectra that result from the interaction between electromagnetic radiation and matter as a function of the wavelength or frequency of the radiation. Matter waves and acoustic waves can also be considered forms of radiative energy, and recently gravitational waves have been associated with a spectral signature in the context of the Laser Interferometer Gravitational-Wave Observatory (LIGO).

In astronomy, stellar classification is the classification of stars based on their spectral characteristics. Electromagnetic radiation from the star is analyzed by splitting it with a prism or diffraction grating into a spectrum exhibiting the rainbow of colors interspersed with spectral lines. Each line indicates a particular chemical element or molecule, with the line strength indicating the abundance of that element. The strengths of the different spectral lines vary mainly due to the temperature of the photosphere, although in some cases there are true abundance differences. The spectral class of a star is a short code primarily summarizing the ionization state, giving an objective measure of the photosphere's temperature.
A spectral line is a weaker or stronger region in an otherwise uniform and continuous spectrum, resulting from emission or absorption of light in a narrow frequency range, compared with the nearby frequencies. Spectral lines are often used to identify atoms and molecules. These "fingerprints" can be compared to the previously collected ones of atoms and molecules, and are thus used to identify the atomic and molecular components of stars and planets, which would otherwise be impossible.

Absorption spectroscopy refers to spectroscopic techniques that measure the absorption of electromagnetic radiation, as a function of frequency or wavelength, due to its interaction with a sample. The sample absorbs energy, i.e., photons, from the radiating field. The intensity of the absorption varies as a function of frequency, and this variation is the absorption spectrum. Absorption spectroscopy is performed across the electromagnetic spectrum.
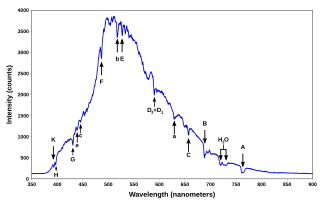
The Balmer series, or Balmer lines in atomic physics, is one of a set of six named series describing the spectral line emissions of the hydrogen atom. The Balmer series is calculated using the Balmer formula, an empirical equation discovered by Johann Balmer in 1885.

A spectral color is a color that is evoked by monochromatic light, i.e. either a single wavelength of light in the visible spectrum, or a relatively narrow band of wavelengths. Every wavelength of visible light is perceived as a spectral color; when viewed as a continuous spectrum, these colors are seen as the familiar rainbow.
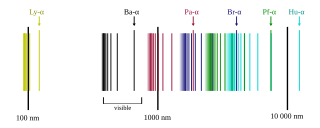
The emission spectrum of atomic hydrogen has been divided into a number of spectral series, with wavelengths given by the Rydberg formula. These observed spectral lines are due to the electron making transitions between two energy levels in an atom. The classification of the series by the Rydberg formula was important in the development of quantum mechanics. The spectral series are important in astronomical spectroscopy for detecting the presence of hydrogen and calculating red shifts.
Maximum entropy spectral estimation is a method of spectral density estimation. The goal is to improve the spectral quality based on the principle of maximum entropy. The method is based on choosing the spectrum which corresponds to the most random or the most unpredictable time series whose autocorrelation function agrees with the known values. This assumption, which corresponds to the concept of maximum entropy as used in both statistical mechanics and information theory, is maximally non-committal with regard to the unknown values of the autocorrelation function of the time series. It is simply the application of maximum entropy modeling to any type of spectrum and is used in all fields where data is presented in spectral form. The usefulness of the technique varies based on the source of the spectral data since it is dependent on the amount of assumed knowledge about the spectrum that can be applied to the model.
In statistical signal processing, the goal of spectral density estimation (SDE) or simply spectral estimation is to estimate the spectral density of a signal from a sequence of time samples of the signal. Intuitively speaking, the spectral density characterizes the frequency content of the signal. One purpose of estimating the spectral density is to detect any periodicities in the data, by observing peaks at the frequencies corresponding to these periodicities.
HR 178 is a probable binary star in the constellation Andromeda. Located approximately 124 parsecs (400 ly) distant, it is an evolved Am star with a combined apparent magnitude of 6.06, meaning that it can only be seen with the naked eye on dark, clear nights. The star is suspected of variability, possibly varying between magnitudes 6.04 and 6.06. The variable magnitude period of HD 3883 is about 9.17 min.
An extreme helium star is a low-mass supergiant that is almost devoid of hydrogen, the most common chemical element of the Universe. Since there are no known conditions where stars devoid of hydrogen can be formed from molecular clouds, it is theorized that they are the product of the mergers of helium-core and carbon-oxygen core white dwarfs.

A shell star is a star having a spectrum that shows extremely broad absorption lines, plus some very narrow absorption lines. They typically also show some emission lines, usually from the Balmer series but occasionally of other lines. The broad absorption lines are due to rapid rotation of the photosphere, the emission lines from an equatorial disk, and the narrow absorption lines are produced when the disc is seen nearly edge-on.

The photosphere denotes those solar or stellar surface layers from which optical radiation escapes. These stellar outer layers can be modeled by different computer programs. Often, calculated models are used, together with other programs, to calculate synthetic spectra for stars. For example, in varying the assumed abundance of a chemical element, and comparing the synthetic spectra to observed ones, the abundance of that element in that particular star can be determined. As computers have evolved, the complexity of the models has deepened, becoming more realistic in including more physical data and excluding more of the simplifying assumptions. This evolution of the models has also made them applicable to different kinds of stars.

HD 5980 is a multiple star system on the outskirts of NGC 346 in the Small Magellanic Cloud (SMC) and is one of the brightest stars in the SMC.
Sidus Ludoviciana, also known as HD 116798 is an 8th-magnitude giant star in the asterism of the Big Dipper in the constellation Ursa Major, halfway between Mizar and Alcor. It was discovered on 2 December 1722 by Johann Georg Liebknecht, who mistook it for a planet and named it after Louis V, Landgrave of Hesse-Darmstadt. A line-of-sight companion with Mizar and Alcor, it is roughly four times more distant. It has the spectral type A8/F0 III. That spectral class suggests it is a giant star, but evolutionary models place it on the main sequence.
In astronomy, a spectral atlas is a collection of spectra of one or more objects, intended as a reference work for comparison with spectra of other objects. Several different types of collections are titled spectral atlases: those intended for spectral classification, for key reference, or as a collection of spectra of a general type of object.
Stellar molecules are molecules that exist or form in stars. Such formations can take place when the temperature is low enough for molecules to form – typically around 6000 K or cooler. Otherwise the stellar matter is restricted to atoms in the forms of gas or – at very high temperatures – plasma.

WR 30a is a massive spectroscopic binary in the constellation Carina. The primary is an extremely rare star on the WO oxygen sequence and the secondary a massive class O star. It appears near the Carina Nebula but is much further away.
V1309 Scorpii is a contact binary that merged into a single star in 2008 in a process known as a luminous red nova. It was the first star to provide conclusive evidence that contact binary systems end their evolution in a stellar merger. Its similarities to V838 Monocerotis and V4332 Sagittarii allowed scientists to identify these stars as merged contact binaries as well.