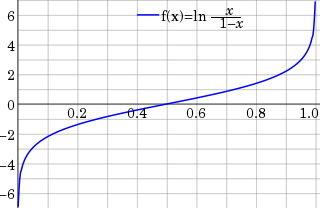
In statistics, the logit function is the quantile function associated with the standard logistic distribution. It has many uses in data analysis and machine learning, especially in data transformations.

In statistics, the logistic model is a statistical model that models the log-odds of an event as a linear combination of one or more independent variables. In regression analysis, logistic regression estimates the parameters of a logistic model. In binary logistic regression there is a single binary dependent variable, coded by an indicator variable, where the two values are labeled "0" and "1", while the independent variables can each be a binary variable or a continuous variable. The corresponding probability of the value labeled "1" can vary between 0 and 1, hence the labeling; the function that converts log-odds to probability is the logistic function, hence the name. The unit of measurement for the log-odds scale is called a logit, from logistic unit, hence the alternative names. See § Background and § Definition for formal mathematics, and § Example for a worked example.
In statistics, a generalized linear model (GLM) is a flexible generalization of ordinary linear regression. The GLM generalizes linear regression by allowing the linear model to be related to the response variable via a link function and by allowing the magnitude of the variance of each measurement to be a function of its predicted value.
In statistics, a probit model is a type of regression where the dependent variable can take only two values, for example married or not married. The word is a portmanteau, coming from probability + unit. The purpose of the model is to estimate the probability that an observation with particular characteristics will fall into a specific one of the categories; moreover, classifying observations based on their predicted probabilities is a type of binary classification model.
In statistics, the ordered logit model is an ordinal regression model—that is, a regression model for ordinal dependent variables—first considered by Peter McCullagh. For example, if one question on a survey is to be answered by a choice among "poor", "fair", "good", "very good" and "excellent", and the purpose of the analysis is to see how well that response can be predicted by the responses to other questions, some of which may be quantitative, then ordered logistic regression may be used. It can be thought of as an extension of the logistic regression model that applies to dichotomous dependent variables, allowing for more than two (ordered) response categories.
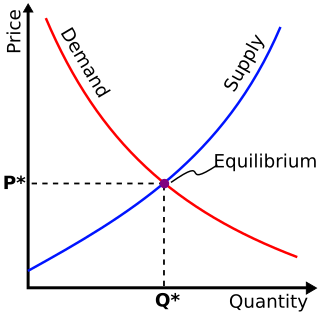
In economics, discrete choice models, or qualitative choice models, describe, explain, and predict choices between two or more discrete alternatives, such as entering or not entering the labor market, or choosing between modes of transport. Such choices contrast with standard consumption models in which the quantity of each good consumed is assumed to be a continuous variable. In the continuous case, calculus methods can be used to determine the optimum amount chosen, and demand can be modeled empirically using regression analysis. On the other hand, discrete choice analysis examines situations in which the potential outcomes are discrete, such that the optimum is not characterized by standard first-order conditions. Thus, instead of examining "how much" as in problems with continuous choice variables, discrete choice analysis examines "which one". However, discrete choice analysis can also be used to examine the chosen quantity when only a few distinct quantities must be chosen from, such as the number of vehicles a household chooses to own and the number of minutes of telecommunications service a customer decides to purchase. Techniques such as logistic regression and probit regression can be used for empirical analysis of discrete choice.
RATS, an abbreviation of Regression Analysis of Time Series, is a statistical package for time series analysis and econometrics. RATS is developed and sold by Estima, Inc., located in Evanston, IL.
The topic of heteroskedasticity-consistent (HC) standard errors arises in statistics and econometrics in the context of linear regression and time series analysis. These are also known as heteroskedasticity-robust standard errors, Eicker–Huber–White standard errors, to recognize the contributions of Friedhelm Eicker, Peter J. Huber, and Halbert White.
Mixed logit is a fully general statistical model for examining discrete choices. It overcomes three important limitations of the standard logit model by allowing for random taste variation across choosers, unrestricted substitution patterns across choices, and correlation in unobserved factors over time. Mixed logit can choose any distribution for the random coefficients, unlike probit which is limited to the normal distribution. It is called "mixed logit" because the choice probability is a mixture of logits, with as the mixing distribution. It has been shown that a mixed logit model can approximate to any degree of accuracy any true random utility model of discrete choice, given appropriate specification of variables and the coefficient distribution.
In statistics and econometrics, the multinomial probit model is a generalization of the probit model used when there are several possible categories that the dependent variable can fall into. As such, it is an alternative to the multinomial logit model as one method of multiclass classification. It is not to be confused with the multivariate probit model, which is used to model correlated binary outcomes for more than one independent variable.
Choice modelling attempts to model the decision process of an individual or segment via revealed preferences or stated preferences made in a particular context or contexts. Typically, it attempts to use discrete choices in order to infer positions of the items on some relevant latent scale. Indeed many alternative models exist in econometrics, marketing, sociometrics and other fields, including utility maximization, optimization applied to consumer theory, and a plethora of other identification strategies which may be more or less accurate depending on the data, sample, hypothesis and the particular decision being modelled. In addition, choice modelling is regarded as the most suitable method for estimating consumers' willingness to pay for quality improvements in multiple dimensions.
The Heckman correction is a statistical technique to correct bias from non-randomly selected samples or otherwise incidentally truncated dependent variables, a pervasive issue in quantitative social sciences when using observational data. Conceptually, this is achieved by explicitly modelling the individual sampling probability of each observation together with the conditional expectation of the dependent variable. The resulting likelihood function is mathematically similar to the tobit model for censored dependent variables, a connection first drawn by James Heckman in 1974. Heckman also developed a two-step control function approach to estimate this model, which avoids the computational burden of having to estimate both equations jointly, albeit at the cost of inefficiency. Heckman received the Nobel Memorial Prize in Economic Sciences in 2000 for his work in this field.
Kenneth E. Train is an adjunct professor of Economics at the University of California, Berkeley, United States. He is also Vice President of NERA Economic Consulting, Inc. in San Francisco, California. He received a Bachelors in Economics at Harvard and PhD from UC Berkeley. He specializes in econometrics and regulation, with applications in energy, environmental studies, telecommunications and transportation.
A Newey–West estimator is used in statistics and econometrics to provide an estimate of the covariance matrix of the parameters of a regression-type model where the standard assumptions of regression analysis do not apply. It was devised by Whitney K. Newey and Kenneth D. West in 1987, although there are a number of later variants. The estimator is used to try to overcome autocorrelation, and heteroskedasticity in the error terms in the models, often for regressions applied to time series data. The abbreviation "HAC," sometimes used for the estimator, stands for "heteroskedasticity and autocorrelation consistent." There are a number of HAC estimators described in, and HAC estimator does not refer uniquely to Newey–West. One version of Newey–West Bartlett requires the user to specify the bandwidth and usage of the Bartlett kernel from Kernel density estimation
The following outline is provided as an overview of and topical guide to regression analysis:
A limited dependent variable is a variable whose range of possible values is "restricted in some important way." In econometrics, the term is often used when estimation of the relationship between the limited dependent variable of interest and other variables requires methods that take this restriction into account. For example, this may arise when the variable of interest is constrained to lie between zero and one, as in the case of a probability, or is constrained to be positive, as in the case of wages or hours worked.

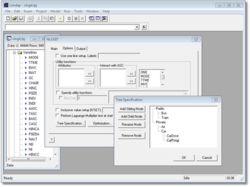
LIMDEP is an econometric and statistical software package with a variety of estimation tools. In addition to the core econometric tools for analysis of cross sections and time series, LIMDEP supports methods for panel data analysis, frontier and efficiency estimation and discrete choice modeling. The package also provides a programming language to allow the user to specify, estimate and analyze models that are not contained in the built in menus of model forms.
In statistics and econometrics, the maximum score estimator is a nonparametric estimator for discrete choice models developed by Charles Manski in 1975. Unlike the multinomial probit and multinomial logit estimators, it makes no assumptions about the distribution of the unobservable part of utility. However, its statistical properties are more complicated than the multinomial probit and logit models, making statistical inference difficult. To address these issues, Joel Horowitz proposed a variant, called the smoothed maximum score estimator.

In statistics, a sequence of random variables is homoscedastic if all its random variables have the same finite variance; this is also known as homogeneity of variance. The complementary notion is called heteroscedasticity, also known as heterogeneity of variance. The spellings homoskedasticity and heteroskedasticity are also frequently used. “Skedasticity” comes from the Ancient Greek word “skedánnymi”, meaning “to scatter”. Assuming a variable is homoscedastic when in reality it is heteroscedastic results in unbiased but inefficient point estimates and in biased estimates of standard errors, and may result in overestimating the goodness of fit as measured by the Pearson coefficient.