
Visualization or visualisation is any technique for creating images, diagrams, or animations to communicate a message. Visualization through visual imagery has been an effective way to communicate both abstract and concrete ideas since the dawn of humanity. Examples from history include cave paintings, Egyptian hieroglyphs, Greek geometry, and Leonardo da Vinci's revolutionary methods of technical drawing for engineering and scientific purposes.

NASA WorldWind is an open-source virtual globe. According to the website, "WorldWind is an open source virtual globe API. WorldWind allows developers to quickly and easily create interactive visualizations of 3D globe, map and geographical information. Organizations around the world use WorldWind to monitor weather patterns, visualize cities and terrain, track vehicle movement, analyze geospatial data and educate humanity about the Earth." It was first developed by NASA in 2003 for use on personal computers and then further developed in concert with the open source community since 2004. As of 2017, a web-based version of WorldWind is available online. An Android version is also available.
Google Maps is a web mapping platform and consumer application offered by Google. It offers satellite imagery, aerial photography, street maps, 360° interactive panoramic views of streets, real-time traffic conditions, and route planning for traveling by foot, car, bike, air and public transportation. As of 2020, Google Maps was being used by over 1 billion people every month around the world.

Google Analytics is a web analytics service offered by Google that tracks and reports website traffic, currently as a platform inside the Google Marketing Platform brand. Google launched the service in November 2005 after acquiring Urchin.
As of October 2012, Jeremy Zawodny is an employee of Craigslist, having previously worked in Yahoo!'s platform engineering group, where he was described as "Yahoo!'s MySQL guru".
Comet is a web application model in which a long-held HTTPS request allows a web server to push data to a browser, without the browser explicitly requesting it. Comet is an umbrella term, encompassing multiple techniques for achieving this interaction. All these methods rely on features included by default in browsers, such as JavaScript, rather than on non-default plugins. The Comet approach differs from the original model of the web, in which a browser requests a complete web page at a time.
Google Developers is Google's site for software development tools and platforms, application programming interfaces (APIs), and technical resources. The site contains documentation on using Google developer tools and APIs—including discussion groups and blogs for developers using Google's developer products.
Gears, formerly Google Gears, is discontinued utility software offered by Google to create more powerful web apps by adding offline storage and other additional features to web browsers. Released under the BSD license, Gears is free and open-source. Gears was conceived at a time when a comparable alternative was not available. However, Gears was discontinued in favor of the standardized HTML5 methods that eventually became prevalent.
Tableau Software is an American interactive data visualization software company focused on business intelligence. It was founded in 2003 in Mountain View, California, and is currently headquartered in Seattle, Washington. In 2019 the company was acquired by Salesforce for $15.7 billion. At the time, this was the largest acquisition by Salesforce since its foundation. It was later surpassed by Salesforce's acquisition of Slack.

WebGL is a JavaScript API for rendering interactive 2D and 3D graphics within any compatible web browser without the use of plug-ins. WebGL is fully integrated with other web standards, allowing GPU-accelerated usage of physics and image processing and effects as part of the web page canvas. WebGL elements can be mixed with other HTML elements and composited with other parts of the page or page background.

AppScale is a software company offering cloud infrastructure software and services to enterprises, government agencies, contractors and third party service providers. The company commercially supports one software product, AppScale ATS, a managed hybrid cloud infrastructure software platform that emulates the core AWS APIs. In 2019, the company ended commercial support for its open-source serverless computing platform AppScale GTS, however its source code remains freely available to the open-source community.
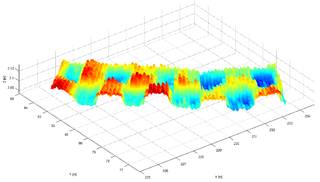
OpenCRG is a complete free and open-source project for the creation, modification and evaluation of road surfaces, and an open file format specification CRG. Its objective is to standardize a detailed road surface description and it may be used for applications like tire-, vibration- or driving-simulation.
Modern HTML5 has feature-parity with Adobe Flash. Both include features for playing audio and video within web pages. Flash is specifically built to integrate vector graphics and light games in a web page, features that HTML5 also supports.

Google Fusion Tables was a web service provided by Google for data management. Fusion tables can be used for gathering, visualising and sharing data tables. Data are stored in multiple tables that Internet users can view and download.
Yossi Matias is an Israeli computer scientist, entrepreneur and Google executive.

Google Chrome Experiments is an online showroom of web browser based experiments, interactive programs, and artistic projects. Launched on March 1, 2009, Google Chrome Experiments is an official Google website that was originally meant to test the limits of JavaScript and the Google Chrome browser's performance and abilities. As the project progressed, it took the role of showcasing and experimenting latest open-source web-based technologies, such as JavaScript, HTML5, WebGL, Canvas, SVG, CSS, and some others. All the projects on Chrome experiments are user submitted and are made using open source technologies. As of February 24, 2015, there were 1,000 different Chrome projects posted on the website.

CARTO is a Software as a Service (SaaS) cloud computing platform that provides GIS, web mapping, and spatial data science tools. The company is positioned as a Location Intelligence platform due to tools with an aptitude for data analysis and visualization that do not require previous GIS or development experience.
Google Cloud Platform (GCP), offered by Google, is a suite of cloud computing services that runs on the same infrastructure that Google uses internally for its end-user products, such as Google Search, Gmail, Google Drive, and YouTube. Alongside a set of management tools, it provides a series of modular cloud services including computing, data storage, data analytics and machine learning. Registration requires a credit card or bank account details.

BioDigital is a New York-based biomedical visualization company that is often referred to as being "Google Earth for the Human Body". BioDigital offers an interactive, 3D software platform that enables individuals and business to explore and visualize health information. Their flagship product, the BioDigital Human, is a "searchable, customizable map of the human body".
Alex Wellerstein is a historian of science at the Stevens Institute of Technology who studies the history of nuclear weapons. He is the creator of NUKEMAP.
