An Earth observation satellite or Earth remote sensing satellite is a satellite used or designed for Earth observation (EO) from orbit, including spy satellites and similar ones intended for non-military uses such as environmental monitoring, meteorology, cartography and others. The most common type are Earth imaging satellites, that take satellite images, analogous to aerial photographs; some EO satellites may perform remote sensing without forming pictures, such as in GNSS radio occultation.

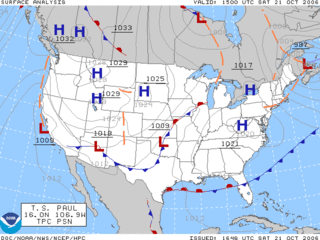
Surface weather analysis is a special type of weather map that provides a view of weather elements over a geographical area at a specified time based on information from ground-based weather stations.

Weather forecasting is the application of science and technology to predict the conditions of the atmosphere for a given location and time. People have attempted to predict the weather informally for millennia and formally since the 19th century.
The timeline of meteorology contains events of scientific and technological advancements in the area of atmospheric sciences. The most notable advancements in observational meteorology, weather forecasting, climatology, atmospheric chemistry, and atmospheric physics are listed chronologically. Some historical weather events are included that mark time periods where advancements were made, or even that sparked policy change.

A weather satellite or meteorological satellite is a type of Earth observation satellite that is primarily used to monitor the weather and climate of the Earth. Satellites are mainly of two types: polar orbiting or geostationary.

In meteorology, precipitation is any product of the condensation of atmospheric water vapor that falls from clouds due to gravitational pull. The main forms of precipitation include drizzle, rain, sleet, snow, ice pellets, graupel and hail. Precipitation occurs when a portion of the atmosphere becomes saturated with water vapor, so that the water condenses and "precipitates" or falls. Thus, fog and mist are not precipitation; their water vapor does not condense sufficiently to precipitate, so fog and mist do not fall. Two processes, possibly acting together, can lead to air becoming saturated with water vapor: cooling the air or adding water vapor to the air. Precipitation forms as smaller droplets coalesce via collision with other rain drops or ice crystals within a cloud. Short, intense periods of rain in scattered locations are called showers.

A weather map, also known as synoptic weather chart, displays various meteorological features across a particular area at a particular point in time and has various symbols which all have specific meanings. Such maps have been in use since the mid-19th century and are used for research and weather forecasting purposes. Maps using isotherms show temperature gradients, which can help locate weather fronts. Isotach maps, analyzing lines of equal wind speed, on a constant pressure surface of 300 or 250 hPa show where the jet stream is located. Use of constant pressure charts at the 700 and 500 hPa level can indicate tropical cyclone motion. Two-dimensional streamlines based on wind speeds at various levels show areas of convergence and divergence in the wind field, which are helpful in determining the location of features within the wind pattern. A popular type of surface weather map is the surface weather analysis, which plots isobars to depict areas of high pressure and low pressure. Cloud codes are translated into symbols and plotted on these maps along with other meteorological data that are included in synoptic reports sent by professionally trained observers.

The Weather Prediction Center (WPC), located in College Park, Maryland, is one of nine service centers under the umbrella of the National Centers for Environmental Prediction (NCEP), a part of the National Weather Service (NWS), which in turn is part of the National Oceanic and Atmospheric Administration (NOAA) of the U.S. Government. Until March 5, 2013, the Weather Prediction Center was known as the Hydrometeorological Prediction Center (HPC). The Weather Prediction Center serves as a center for quantitative precipitation forecasting, medium range forecasting, and the interpretation of numerical weather prediction computer models.

Satellite images are images of Earth collected by imaging satellites operated by governments and businesses around the world. Satellite imaging companies sell images by licensing them to governments and businesses such as Apple Maps and Google Maps.

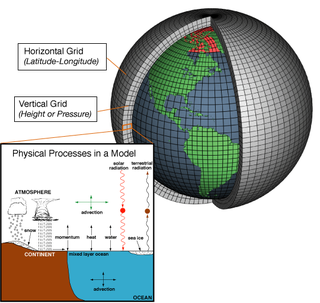
Numerical weather prediction (NWP) uses mathematical models of the atmosphere and oceans to predict the weather based on current weather conditions. Though first attempted in the 1920s, it was not until the advent of computer simulation in the 1950s that numerical weather predictions produced realistic results. A number of global and regional forecast models are run in different countries worldwide, using current weather observations relayed from radiosondes, weather satellites and other observing systems as inputs.

An outflow boundary, also known as a gust front, is a storm-scale or mesoscale boundary separating thunderstorm-cooled air (outflow) from the surrounding air; similar in effect to a cold front, with passage marked by a wind shift and usually a drop in temperature and a related pressure jump. Outflow boundaries can persist for 24 hours or more after the thunderstorms that generated them dissipate, and can travel hundreds of kilometers from their area of origin. New thunderstorms often develop along outflow boundaries, especially near the point of intersection with another boundary. Outflow boundaries can be seen either as fine lines on weather radar imagery or else as arcs of low clouds on weather satellite imagery. From the ground, outflow boundaries can be co-located with the appearance of roll clouds and shelf clouds.

The eye is a region of mostly calm weather at the center of a tropical cyclone. The eye of a storm is a roughly circular area, typically 30–65 kilometers in diameter. It is surrounded by the eyewall, a ring of towering thunderstorms where the most severe weather and highest winds of the cyclone occur. The cyclone's lowest barometric pressure occurs in the eye and can be as much as 15 percent lower than the pressure outside the storm.

In atmospheric science, an atmospheric model is a mathematical model constructed around the full set of primitive, dynamical equations which govern atmospheric motions. It can supplement these equations with parameterizations for turbulent diffusion, radiation, moist processes, heat exchange, soil, vegetation, surface water, the kinematic effects of terrain, and convection. Most atmospheric models are numerical, i.e. they discretize equations of motion. They can predict microscale phenomena such as tornadoes and boundary layer eddies, sub-microscale turbulent flow over buildings, as well as synoptic and global flows. The horizontal domain of a model is either global, covering the entire Earth, or regional (limited-area), covering only part of the Earth. Atmospheric models also differ in how they compute vertical fluid motions; some types of models are thermotropic, barotropic, hydrostatic, and non-hydrostatic. These model types are differentiated by their assumptions about the atmosphere, which must balance computational speed with the model's fidelity to the atmosphere it is simulating.

In meteorology, an okta is a unit of measurement used to describe the amount of cloud cover at any given location such as a weather station. Sky conditions are estimated in terms of how many eighths of the sky are covered in cloud, ranging from 0 oktas through to 8 oktas. In addition, in the SYNOP code there is an extra cloud cover indicator '9' indicating that the sky is totally obscured, usually due to dense fog or heavy snow.

In meteorology, station models are symbolic illustrations showing the weather occurring at a given reporting station. Meteorologists created the station model to fit a number of weather elements into a small space on weather maps. This allows map users to analyze patterns in atmospheric pressure, temperature, wind speed and direction, cloud cover, precipitation, and other parameters. The most common station plots depict surface weather observations although upper air plots at various mandatory levels are also frequently depicted.

Meteorological instruments, including meteorological sensors, are the equipment used to find the state of the atmosphere at a given time. Each science has its own unique sets of laboratory equipment. Meteorology, however, is a science which does not use much laboratory equipment but relies more on on-site observation and remote sensing equipment. In science, an observation, or observable, is an abstract idea that can be measured and for which data can be taken. Rain was one of the first quantities to be measured historically. Two other accurately measured weather-related variables are wind and humidity. Many attempts had been made prior to the 15th century to construct adequate equipment to measure atmospheric variables.

Convective storm detection is the meteorological observation, and short-term prediction, of deep moist convection (DMC). DMC describes atmospheric conditions producing single or clusters of large vertical extension clouds ranging from cumulus congestus to cumulonimbus, the latter producing thunderstorms associated with lightning and thunder. Those two types of clouds can produce severe weather at the surface and aloft.

Surface weather observations are the fundamental data used for safety as well as climatological reasons to forecast weather and issue warnings worldwide. They can be taken manually, by a weather observer, by computer through the use of automated weather stations, or in a hybrid scheme using weather observers to augment the otherwise automated weather station. The ICAO defines the International Standard Atmosphere (ISA), which is the model of the standard variation of pressure, temperature, density, and viscosity with altitude in the Earth's atmosphere, and is used to reduce a station pressure to sea level pressure. Airport observations can be transmitted worldwide through the use of the METAR observing code. Personal weather stations taking automated observations can transmit their data to the United States mesonet through the Citizen Weather Observer Program (CWOP), the UK Met Office through their Weather Observations Website (WOW), or internationally through the Weather Underground Internet site. A thirty-year average of a location's weather observations is traditionally used to determine the station's climate. In the US a network of Cooperative Observers make a daily record of summary weather and sometimes water level information.

Weather reconnaissance is the acquisition of weather data used for research and planning. Typically the term reconnaissance refers to observing weather from the air, as opposed to the ground.

Himawari 8 (ひまわり8号) is a Japanese weather satellite, the 8th of the Himawari geostationary weather satellites operated by the Japan Meteorological Agency. The spacecraft was constructed by Mitsubishi Electric with assistance from Boeing, and is the first of two similar satellites to be based on the DS2000 satellite bus. Himawari 8 entered operational service on 7 July 2015 and is the successor to MTSAT-2 which was launched in 2006.


