Weather front

Last updated

Approaching weather fronts are often visible from the ground, but are not always as well defined as this. Unusually well defined warm front.jpg
Approaching weather fronts are often visible from the ground, but are not always as well defined as this.

A weather front is a boundary separating air masses for which several characteristics differ, such as air density, wind, temperature, and humidity. Disturbed and unstable weather due to these differences often arises along the boundary. For instance, cold fronts can bring bands of thunderstorms and cumulonimbus precipitation or be preceded by squall lines, while warm fronts are usually preceded by stratiform precipitation and fog. In summer, subtler humidity gradients known as dry lines can trigger severe weather. Some fronts produce no precipitation and little cloudiness, although there is invariably a wind shift. [1]

Contents

Cold fronts generally move from west to east, whereas warm fronts move poleward, although any direction is possible. Occluded fronts are a hybrid merge of the two, and stationary fronts are stalled in their motion. Cold fronts and cold occlusions move faster than warm fronts and warm occlusions because the dense air behind them can lift as well as push the warmer air. Mountains and bodies of water can affect the movement and properties of fronts, other than atmospheric conditions. [2] When the density contrast has diminished between the air masses, for instance after flowing out over a uniformly warm ocean, the front can degenerate into a mere line which separates regions of differing wind velocity known as a shear line. This is most common over the open ocean.

Bergeron classification of air masses

The Bergeron classification is the most widely accepted form of air mass classification. Air mass classifications are indicated by three letters: [3] [4] Fronts separate air masses of different types or origins, and are located along troughs of lower pressure. [5]

Different air masses which affect North America, as well as other continents, tend to be separated by frontal boundaries. In this illustration, the Arctic front separates Arctic from Polar air masses, while the Polar front separates Polar air from warm air masses. (cA is continental arctic; cP is continental polar; mP is maritime polar; cT is continental tropic; and mT is maritime tropic.) Airmassesorigin.png
Different air masses which affect North America, as well as other continents, tend to be separated by frontal boundaries. In this illustration, the Arctic front separates Arctic from Polar air masses, while the Polar front separates Polar air from warm air masses. (cA is continental arctic; cP is continental polar; mP is maritime polar; cT is continental tropic; and mT is maritime tropic.)

Surface weather analysis

Weather map symbols:

.mw-parser-output .div-col{margin-top:0.3em;column-width:30em}.mw-parser-output .div-col-small{font-size:90%}.mw-parser-output .div-col-rules{column-rule:1px solid #aaa}.mw-parser-output .div-col dl,.mw-parser-output .div-col ol,.mw-parser-output .div-col ul{margin-top:0}.mw-parser-output .div-col li,.mw-parser-output .div-col dd{page-break-inside:avoid;break-inside:avoid-column}
1. cold front
2. warm front
3. stationary front
4. occluded front
5. surface trough
6. squall / shear line
7. dry line
8. tropical wave
9. trough NWS weather fronts.svg
Weather map symbols:
1. cold front
2. warm front
3. stationary front
4. occluded front
5. surface trough
6. squall / shear line
7. dry line
8. tropical wave
9. trough

A surface weather analysis is a special type of weather map which provides a top view of weather elements over a geographical area at a specified time based on information from ground-based weather stations. [6] Weather maps are created by detecting, plotting and tracing the values of relevant quantities such as sea-level pressure, temperature, and cloud cover onto a geographical map to help find synoptic scale features such as weather fronts. [7] Surface weather analyses have special symbols which show frontal systems, cloud cover, precipitation, or other important information. For example, an H may represent a high pressure area, implying fair or clear weather. An L on the other hand may represent low pressure, which frequently accompanies precipitation and storms. Low pressure also creates surface winds deriving from high pressure zones and vice versa. Various symbols are used not just for frontal zones and other surface boundaries on weather maps, but also to depict the present weather at various locations on the weather map. In addition, areas of precipitation help determine the frontal type and location. [6]

Types

There are two different meanings used within meteorology to describe weather around a frontal zone. The term "anafront" describes boundaries which show instability, meaning air rises rapidly along and over the boundary to cause significant weather changes and heavy precipitation. A "katafront" is weaker, bringing smaller changes in temperature and moisture, as well as limited rainfall. [8]

Cold front

A cold front is located along and on the bounds of the warm side of a tightly packed temperature gradient. On surface analysis charts, this temperature gradient is visible in isotherms and can sometimes also be identified using isobars since cold fronts often align with a surface trough. On weather maps, the surface position of the cold front is marked by a blue line with triangles pointing in the direction where cold air travels and it is placed at the leading edge of the cooler air mass. [2] Cold fronts often bring rain, and sometimes heavy thunderstorms as well. Cold fronts can produce sharper and more intense changes in weather and move at a rate that is up to twice as fast as warm fronts, since cold air is more dense than warm air, lifting as well as pushing the warm air preceding the boundary. The lifting motion often creates a narrow line of showers and thunderstorms if enough humidity is present as the lifted moist warm air condenses. The concept of colder, dense air "wedging" under the less dense warmer air is too simplistic, [9] as the upward motion is really part of a maintenance process for geostrophic balance on the rotating Earth in response to frontogenesis.

Warm front

Warm fronts are at the leading edge of a homogeneous advancing warm air mass, which is located on the equatorward edge of the gradient in isotherms, and lie within broader troughs of low pressure than cold fronts. A warm front moves more slowly than the cold front which usually follows because cold air is denser and harder to lift from the Earth's surface. [2]

This also forces temperature differences across warm fronts to be broader in scale. Clouds appearing ahead of the warm front are mostly stratiform, and rainfall more gradually increases as the front approaches. Fog can also occur preceding a warm frontal passage. Clearing and warming is usually rapid after frontal passage. If the warm air mass is unstable, thunderstorms may be embedded among the stratiform clouds ahead of the front, and after frontal passage thundershowers may still continue. On weather maps, the surface location of a warm front is marked with a red line of semicircles pointing in the direction the airmass is travelling. [2]

Occluded front

Occluded front depiction for the Northern Hemisphere Occluded cyclone.svg
Occluded front depiction for the Northern Hemisphere

An occluded front is formed when a cold front overtakes a warm front, [10] and usually forms around mature low-pressure areas, including cyclones. [2] The cold and warm fronts curve naturally poleward into the point of occlusion, which is also known as the triple point. [11] It lies within a sharp trough, but the air mass behind the boundary can be either warm or cold. In a cold occlusion, the air mass overtaking the warm front is cooler than the cold airmass receding from the warm front and plows under both air masses. In a warm occlusion, the cold air mass overtaking the warm front is warmer than the cold airmass receding from the warm front and rides over the colder air while lifting the warm air. [2]

A wide variety of weather can be found along an occluded front, with thunderstorms possible, but usually their passage is also associated with a drying of the air mass. Within the occlusion of the front, a circulation of air brings warm air upward and sends drafts of cold air downward, or vice versa depending on the type of occlusion the front is experiencing. Precipitations and clouds are associated with the trowal , the projection on the Earth's surface of the tongue of warm air aloft formed during the occlusion process of the depression or storm. [12]

Occluded fronts are indicated on a weather map by a purple line with alternating half-circles and triangles pointing in direction of travel. [2] The trowal is indicated by a series of blue and red junction lines.

Warm sector

The warm sector is a near-surface air mass in between the warm front and the cold front, usually found on the equatorward side of an extratropical cyclone. With its warm and humid characteristics, this air is susceptive to convective instability and can sustain thunderstorms, especially if lifted by the advancing cold front.

Stationary front

A stationary front is a non-moving (or stalled) boundary between two air masses, neither of which is strong enough to replace the other. They tend to remain essentially in the same area for extended periods of time, especially with parallel winds directions; [13] They usually move in waves but not persistently. [14] There is normally a broad temperature gradient behind the boundary with more widely spaced isotherm packing.

A wide variety of weather can be found along a stationary front, but usually clouds and prolonged precipitation are found there. Stationary fronts either dissipate after several days or devolve into shear lines, but they can transform into a cold or warm front if the conditions aloft change. Stationary fronts are marked on weather maps with alternating red half-circles and blue spikes pointing opposite to each other, indicating no significant movement.

When stationary fronts become smaller in scale and stabilizes in temperature, degenerating to a narrow zone where wind direction changes significantly over a relatively short distance, they become known as shearlines. [15] A shearline is depicted as a line of red dots and dashes. [2] Stationary fronts may bring light snow or rain for a long period of time.

Dry line

A similar phenomenon to a weather front is the dry line, which is the boundary between air masses with significant moisture differences instead of temperature. When the westerlies increase on the north side of surface highs, areas of lowered pressure will form downwind of north–south oriented mountain chains, leading to the formation of a lee trough. Near the surface during daylight hours, warm moist air is denser than dry air of greater temperature, and thus the warm moist air wedges under the drier air like a cold front. At higher altitudes, the warm moist air is less dense than the cooler dry air and the boundary slope reverses. In the vicinity of the reversal aloft, severe weather is possible, especially when an occlusion or triple point is formed with a cold front. [16] A weaker form of the dry line seen more commonly is the lee trough, which displays weaker differences in moisture. When moisture pools along the boundary during the warm season, it can be the focus of diurnal thunderstorms. [17]

The dry line may occur anywhere on earth in regions intermediate between desert areas and warm seas. The southern plains west of the Mississippi River in the United States are a particularly favored location. The dry line normally moves eastward during the day and westward at night. A dry line is depicted on National Weather Service (NWS) surface analyses as an orange line with scallops facing into the moist sector. Dry lines are one of the few surface fronts where the pips indicated do not necessarily reflect the direction of motion. [18]

Squall line

A shelf cloud such as this one can be a sign that a squall is imminent DangerousShelfCloud.jpg
A shelf cloud such as this one can be a sign that a squall is imminent

Organized areas of thunderstorm activity not only reinforce pre-existing frontal zones, but can outrun actively existing cold fronts in a pattern where the upper level jet splits apart into two streams, with the resultant Mesoscale Convective System (MCS) forming at the point of the upper level split in the wind pattern running southeast into the warm sector parallel to low-level thickness lines. When the convection is strong and linear or curved, the MCS is called a squall line, with the feature placed at the leading edge of the significant wind shift and pressure rise. [19] Even weaker and less organized areas of thunderstorms lead to locally cooler air and higher pressures, and outflow boundaries exist ahead of this type of activity, which can act as foci for additional thunderstorm activity later in the day. [20]

These features are often depicted in the warm season across the United States on surface analyses and lie within surface troughs. If outflow boundaries or squall lines form over arid regions, a haboob may result. [21] Squall lines are depicted on NWS surface analyses as an alternating pattern of two red dots and a dash labelled SQLN or squal line, while outflow boundaries are depicted as troughs with a label of outflow boundary.

Precipitation produced

Convective precipitation Konvektionsregen.jpg
Convective precipitation

Fronts are the principal cause of significant weather. Convective precipitation (showers, thundershowers, heavy rain and related unstable weather) is caused by air being lifted and condensing into clouds by the movement of the cold front or cold occlusion under a mass of warmer, moist air. If the temperature differences of the two air masses involved are large and the turbulence is extreme because of wind shear and the presence of a strong jet stream, "roll clouds" and tornadoes may occur. [22]

In the warm season, lee troughs, breezes, outflow boundaries and occlusions can lead to convection if enough moisture is available. Orographic precipitation is precipitation created through the lifting action of air due to airmasses moving over terrain such as mountains and hills, which is most common behind cold fronts that move into mountainous areas. It may sometimes occur in advance of warm fronts moving northward to the east of mountainous terrain. However, precipitation along warm fronts is relatively steady, as in light rain or drizzle. Fog, sometimes extensive and dense, often occurs in pre-warm-frontal areas. [23] Although, not all fronts produce precipitation or even clouds because moisture must be present in the air mass which is being lifted. [1]

Movement

Fronts are generally guided by winds aloft, but do not move as quickly. Cold fronts and occluded fronts in the Northern Hemisphere usually travel from the northwest to southeast, while warm fronts move more poleward with time. In the Northern Hemisphere a warm front moves from southwest to northeast. In the Southern Hemisphere, the reverse is true; a cold or occluded front usually moves from southwest to northeast, and a warm front moves from northwest to southeast. Movement is largely caused by the pressure gradient force (horizontal differences in atmospheric pressure) and the Coriolis effect, which is caused by Earth's spinning about its axis. Frontal zones can be slowed by geographic features like mountains and large bodies of warm water. [2]

See also

Related Research Articles

<span class="mw-page-title-main">Thunderstorm</span> Type of weather with lightning and thunder

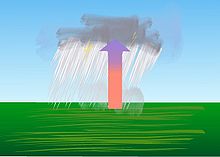
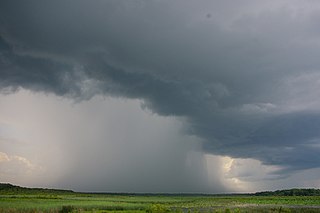
A thunderstorm, also known as an electrical storm or a lightning storm, is a storm characterized by the presence of lightning and its acoustic effect on the Earth's atmosphere, known as thunder. Relatively weak thunderstorms are sometimes called thundershowers. Thunderstorms occur in a type of cloud known as a cumulonimbus. They are usually accompanied by strong winds and often produce heavy rain and sometimes snow, sleet, or hail, but some thunderstorms produce little precipitation or no precipitation at all. Thunderstorms may line up in a series or become a rainband, known as a squall line. Strong or severe thunderstorms include some of the most dangerous weather phenomena, including large hail, strong winds, and tornadoes. Some of the most persistent severe thunderstorms, known as supercells, rotate as do cyclones. While most thunderstorms move with the mean wind flow through the layer of the troposphere that they occupy, vertical wind shear sometimes causes a deviation in their course at a right angle to the wind shear direction.

<span class="mw-page-title-main">Surface weather analysis</span> Type of weather map

Surface weather analysis is a special type of weather map that provides a view of weather elements over a geographical area at a specified time based on information from ground-based weather stations.

<span class="mw-page-title-main">Anticyclone</span> Weather phenomenon of high pressure, as opposed to a cyclone

An anticyclone is a weather phenomenon defined as a large-scale circulation of winds around a central region of high atmospheric pressure, clockwise in the Northern Hemisphere and counterclockwise in the Southern Hemisphere as viewed from above. Effects of surface-based anticyclones include clearing skies as well as cooler, drier air. Fog can also form overnight within a region of higher pressure.

<span class="mw-page-title-main">Air mass</span> Volume of air defined by its temperature and water vapor content

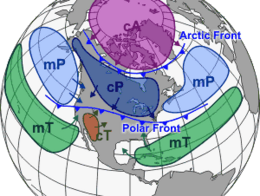
In meteorology, an air mass is a volume of air defined by its temperature and humidity. Air masses cover many hundreds or thousands of square miles, and adapt to the characteristics of the surface below them. They are classified according to latitude and their continental or maritime source regions. Colder air masses are termed polar or arctic, while warmer air masses are deemed tropical. Continental and superior air masses are dry, while maritime and monsoon air masses are moist. Weather fronts separate air masses with different density characteristics. Once an air mass moves away from its source region, underlying vegetation and water bodies can quickly modify its character. Classification schemes tackle an air mass's characteristics, as well as modification.

<span class="mw-page-title-main">Low-pressure area</span> Area with air pressures lower than adjacent areas

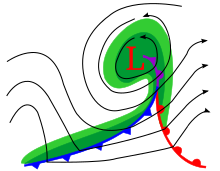
In meteorology, a low-pressure area, low area or low is a region where the atmospheric pressure is lower than that of surrounding locations. Low-pressure areas are commonly associated with inclement weather, while high-pressure areas are associated with lighter winds and clear skies. Winds circle anti-clockwise around lows in the northern hemisphere, and clockwise in the southern hemisphere, due to opposing Coriolis forces. Low-pressure systems form under areas of wind divergence that occur in the upper levels of the atmosphere (aloft). The formation process of a low-pressure area is known as cyclogenesis. In meteorology, atmospheric divergence aloft occurs in two kinds of places:

<span class="mw-page-title-main">Synoptic scale meteorology</span> 1000-km-order method of measuring weather systems

In meteorology, the synoptic scale is a horizontal length scale of the order of 1,000 km (620 mi) or more. This corresponds to a horizontal scale typical of mid-latitude depressions. Most high- and low-pressure areas seen on weather maps are synoptic-scale systems, driven by the location of Rossby waves in their respective hemisphere. Low-pressure areas and their related frontal zones occur on the leading edge of a trough within the Rossby wave pattern, while high-pressure areas form on the back edge of the trough. Most precipitation areas occur near frontal zones. The word synoptic is derived from the Ancient Greek word συνοπτικός (sunoptikós), meaning "seen together".

<span class="mw-page-title-main">Warm front</span> Boundary of advancing mass of warm air

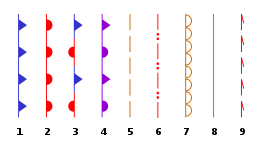
A warm front is a density discontinuity located at the leading edge of a homogeneous warm air mass, and is typically located on the equator-facing edge of an isotherm gradient. Warm fronts lie within broader troughs of low pressure than cold fronts, and move more slowly than the cold fronts which usually follow because cold air is denser and less easy to remove from the Earth's surface. This also forces temperature differences across warm fronts to be broader in scale. Clouds ahead of the warm front are mostly stratiform, and rainfall generally increases as the front approaches. Fog can also occur preceding a warm frontal passage. Clearing and warming is usually rapid after frontal passage. If the warm air mass is unstable, thunderstorms may be embedded among the stratiform clouds ahead of the front, and after frontal passage thundershowers may continue. On weather maps, the surface location of a warm front is marked with a red line of semicircles pointing in the direction of travel.

<span class="mw-page-title-main">Occluded front</span> Meteorological interaction of warm and cool air masses

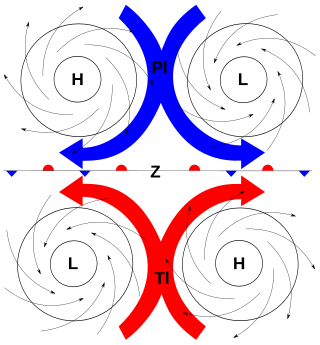
In meteorology, an occluded front is a type of weather front formed during cyclogenesis. The classical and usual view of an occluded front is that it starts when a cold front overtakes a warm front near a cyclone, such that the warm air is separated (occluded) from the cyclone center at the surface. The point where the warm front becomes the occluded front is the triple point; a new area of low-pressure that develops at this point is called a triple-point low. A more modern view of the formation process suggests that occluded fronts form directly without the influence of other fronts during the wrap-up of the baroclinic zone during cyclogenesis, and then lengthen due to flow deformation and rotation around the cyclone as the cyclone forms.

<span class="mw-page-title-main">Cyclogenesis</span> The development or strengthening of cyclonic circulation in the atmosphere

Cyclogenesis is the development or strengthening of cyclonic circulation in the atmosphere. Cyclogenesis is an umbrella term for at least three different processes, all of which result in the development of some sort of cyclone, and at any size from the microscale to the synoptic scale.

<span class="mw-page-title-main">Pressure system</span> Relative peak or lull in the sea level pressure distribution

A pressure system is a peak or lull in the sea level pressure distribution. The surface pressure at sea level varies minimally, with the lowest value measured 87 kilopascals (26 inHg) and the highest recorded 108.57 kilopascals (32.06 inHg). High- and low-pressure systems evolve due to interactions of temperature differentials in the atmosphere, temperature differences between the atmosphere and water within oceans and lakes, the influence of upper-level disturbances, as well as the amount of solar heating or radiationized cooling an area receives. Pressure systems cause weather to be experienced locally. Low-pressure systems are associated with clouds and precipitation that minimize temperature changes throughout the day, whereas high-pressure systems normally associate with dry weather and mostly clear skies with larger diurnal temperature changes due to greater radiation at night and greater sunshine during the day. Pressure systems are analyzed by those in the field of meteorology within surface weather maps.

<span class="mw-page-title-main">Outflow boundary</span> Mesoscale boundary separating outflow from the surrounding air

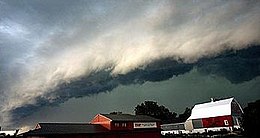
An outflow boundary, also known as a gust front, is a storm-scale or mesoscale boundary separating thunderstorm-cooled air (outflow) from the surrounding air; similar in effect to a cold front, with passage marked by a wind shift and usually a drop in temperature and a related pressure jump. Outflow boundaries can persist for 24 hours or more after the thunderstorms that generated them dissipate, and can travel hundreds of kilometers from their area of origin. New thunderstorms often develop along outflow boundaries, especially near the point of intersection with another boundary. Outflow boundaries can be seen either as fine lines on weather radar imagery or else as arcs of low clouds on weather satellite imagery. From the ground, outflow boundaries can be co-located with the appearance of roll clouds and shelf clouds.

<span class="mw-page-title-main">Rainband</span> Cloud and precipitation structure

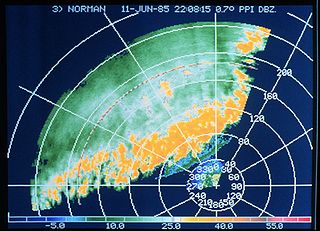
A rainband is a cloud and precipitation structure associated with an area of rainfall which is significantly elongated. Rainbands can be stratiform or convective, and are generated by differences in temperature. When noted on weather radar imagery, this precipitation elongation is referred to as banded structure. Rainbands within tropical cyclones are curved in orientation. Rainbands of tropical cyclones contain showers and thunderstorms that, together with the eyewall and the eye, constitute a hurricane or tropical storm. The extent of rainbands around a tropical cyclone can help determine the cyclone's intensity.

<span class="mw-page-title-main">Snow squall</span> Sudden heavy snowfall accompanied with strong winds

A snow squall, or snowsquall, is a sudden moderately heavy snowfall with blowing snow and strong, gusty surface winds. It is often referred to as a whiteout and is similar to a blizzard but is localized in time or in location and snow accumulations may or may not be significant.

<span class="mw-page-title-main">Extratropical cyclone</span> Type of cyclone

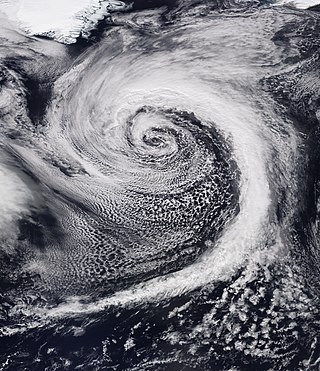
Extratropical cyclones, sometimes called mid-latitude cyclones or wave cyclones, are low-pressure areas which, along with the anticyclones of high-pressure areas, drive the weather over much of the Earth. Extratropical cyclones are capable of producing anything from cloudiness and mild showers to severe gales, thunderstorms, blizzards, and tornadoes. These types of cyclones are defined as large scale (synoptic) low pressure weather systems that occur in the middle latitudes of the Earth. In contrast with tropical cyclones, extratropical cyclones produce rapid changes in temperature and dew point along broad lines, called weather fronts, about the center of the cyclone.

<span class="mw-page-title-main">Precipitation types</span> Characters, formations, and phases of water condensed in the atmosphere

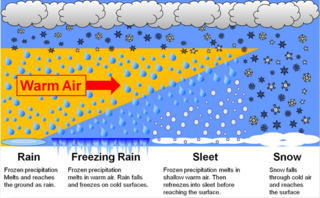
In meteorology, the different types of precipitation often include the character, formation, or phase of the precipitation which is falling to ground level. There are three distinct ways that precipitation can occur. Convective precipitation is generally more intense, and of shorter duration, than stratiform precipitation. Orographic precipitation occurs when moist air is forced upwards over rising terrain and condenses on the slope, such as a mountain.

<span class="mw-page-title-main">Air-mass thunderstorm</span> Thunderstorm that is generally weak and usually not severe

An air-mass thunderstorm, also called an "ordinary", "single cell", "isolated" or "garden variety" thunderstorm, is a thunderstorm that is generally weak and usually not severe. These storms form in environments where at least some amount of Convective Available Potential Energy (CAPE) is present, but with very low levels of wind shear and helicity. The lifting source, which is a crucial factor in thunderstorm development, is usually the result of uneven heating of the surface, though they can be induced by weather fronts and other low-level boundaries associated with wind convergence. The energy needed for these storms to form comes in the form of insolation, or solar radiation. Air-mass thunderstorms do not move quickly, last no longer than an hour, and have the threats of lightning, as well as showery light, moderate, or heavy rainfall. Heavy rainfall can interfere with microwave transmissions within the atmosphere.

<span class="mw-page-title-main">Cold front</span> Leading edge of a cooler mass of air

A cold front is the leading edge of a cooler mass of air at ground level that replaces a warmer mass of air and lies within a pronounced surface trough of low pressure. It often forms behind an extratropical cyclone, at the leading edge of its cold air advection pattern—known as the cyclone's dry "conveyor belt" flow. Temperature differences across the boundary can exceed 30 °C (54 °F) from one side to the other. When enough moisture is present, rain can occur along the boundary. If there is significant instability along the boundary, a narrow line of thunderstorms can form along the frontal zone. If instability is weak, a broad shield of rain can move in behind the front, and evaporative cooling of the rain can increase the temperature difference across the front. Cold fronts are stronger in the fall and spring transition seasons and are weakest during the summer.

The following is a glossary of tornado terms. It includes scientific as well as selected informal terminology.

<span class="mw-page-title-main">Col (meteorology)</span>

A col, also called saddle point or neutral point, is in meteorology, the point of intersection of a trough and a ridge in the pressure pattern of a weather map. It takes the form of a saddle where the air pressure is relatively higher than that of the low-pressure regions, but lower than that of the anticyclonic zones.

<span class="mw-page-title-main">Glossary of meteorology</span> List of definitions of terms and concepts commonly used in meteorology

This glossary of meteorology is a list of terms and concepts relevant to meteorology and atmospheric science, their sub-disciplines, and related fields.

References

  1. 1 2 Miller, Samuel T. (10 November 2000). "Clouds and precipitation". STEC 521 lecture notes. Durham, NH: University of New Hampshire. Archived from the original on 11 January 2005. Retrieved 8 July 2011.
  2. 1 2 3 4 5 6 7 8 9 Roth, David (21 November 2013). Unified Surface Analysis Manual (PDF) (Report) (vers. 1 ed.). Honolulu, HI: NOAA / Hydrometeorological Prediction Center / National Hurricane Center . Retrieved 22 October 2006.
  3. "Airmass classification". Glossary of Meteorology. Retrieved 22 May 2008 via amsglossary.allenpress.com.
  4. Saravanan, K.J., ed. (27 June 2008). "Bergeron classification of air masses". weatherfront.blogspot.com. Retrieved 19 April 2022.
  5. Ahrens, C. Donald (2007). Meteorology Today: An introduction to weather, climate, and the environment. Cengage Learning. p. 296. ISBN   978-0-495-01162-0.
  6. 1 2 Monmonier, Mark S. (1999). Air Apparent: How meteorologists learned to map, predict, and dramatize weather. Chicago, IL: University of Chicago Press. ISBN   0-226-53422-7.
  7. "Mixed surface analysis". Weather Underground (wunderground.com). Current weather maps. Retrieved 19 April 2022.
  8. Park, Chris C. (2001). The Environment: Principles and applications. Psychology Press. p. 309. ISBN   978-0-415-21771-2.
  9. "Overrunning". [letter] 'O'. Glossary. NOAA / National Weather Service . Retrieved 2 May 2010.
  10. "Occluded front". Glossary – Weather World 2010 Project. Online guide. Department of Atmospheric Sciences. University of Illinois . Retrieved 22 October 2006.
  11. "Triple Point". Norman, OK: NOAA / National Weather Service . Retrieved 22 October 2006.
  12. "Trowal". English glossary. World Meteorological Organisation / Eumetcal. Archived from the original on 31 March 2014. Retrieved 28 August 2013.
  13. "Stationary Front". SKYbrary Aviation Safety. 20 July 2021. Retrieved 19 April 2022.
  14. "Stationary front". Glossary – Weather World 2010 Project. Online guide. Department of Atmospheric Sciences. University of Illinois . Retrieved 22 October 2006.
  15. "Shear line". Glossary of Meteorology. American Meteorological Society. Archived from the original on 14 March 2007. Retrieved 22 October 2006 via amsglossary.allenpress.com.
  16. Cai, Huaqing. "Dryline cross section". Archived from the original on 20 January 2008. Retrieved 5 December 2006.
  17. "Lee trough". Glossary of Meteorology. American Meteorological Society. Archived from the original on 19 September 2011. Retrieved 22 October 2006 via amsglossary.allenpress.com.
  18. "Dry line: A moisture boundary". Glossary – Weather World 2010 Project. Online guide. Department of Atmospheric Sciences. University of Illinois . Retrieved 22 October 2006.
  19. "Chapter 2: Definitions" (PDF). Office of the Federal Coordinator for Meteorological Services and Supporting Research. Archived from the original (PDF) on 6 May 2009. Retrieved 22 October 2006.
  20. Branick, Michael. "[letter] 'O'". A Comprehensive Glossary of Weather (Report). American Meteorological Society . Retrieved 22 October 2006 via geographic.org.
  21. "Haboob". Glossary. American Meteorological Society. 8 June 2016.
  22. "Convection". Glossary of Meteorology. American Meteorological Society. Archived from the original on 5 March 2007. Retrieved 22 October 2006 via amsglossary.allenpress.com.
  23. "Orographic lifting". Glossary of Meteorology. American Meteorological Society. Archived from the original on 14 October 2006. Retrieved 22 October 2006 via amsglossary.allenpress.com.

Further reading