Newtownards (District Electoral Area)

Last updated

Newtownards
Ards and North Down Borough Council DEA constituency
Current constituency
Created2014
Seats7 (1985-1993)
6 (1993-2014)
7 (2014–)
Councillors
  •   Naomi Armstrong (DUP)
  •   Steven Irvine (IND)
  •   Colin Kennedy (DUP)
  •   Alan McDowell (APNI)
  •   Stephen McIlveen (DUP)
  •   Vicky Moore (APNI)
  •   Richard Smart (UUP)
Newtownards DEA within Ards and North Down Ards and North Down Newtownards highlight.svg
Newtownards DEA within Ards and North Down

Newtownards is one of the seven district electoral areas (DEA) in Ards and North Down, Northern Ireland. [1] The district elects five members to Ards and North Down Borough Council and contains the wards of Conway Square, Cronstown, Glen, Gregstown, Movilla, Scrabo and West Winds. [2] Newtownards forms part of the Strangford constituencies for the Northern Ireland Assembly and UK Parliament.

Contents

It was created for the 1985 local elections, where it contained seven wards (Bradshaw's Brae, Central, Glen, Loughries, Movilla, Scrabo and Whitespots). For the 1993 local elections, it was reduced to six wards, gaining Ballyrainey but losing Loughries and Movilla to the new Ards East DEA. For the 2014 local elections, it returned to seven wards as Ards East was abolished.

Councillors

ElectionCouncillor
(Party)
Councillor
(Party)
Councillor
(Party)
Councillor
(Party)
Councillor
(Party)
Councillor
(Party)
Councillor
(Party)
2023 Alan McDowell
(Alliance)
Vicky Moore
(Alliance)
Richard Smart
(UUP)
Steven Irvine
(Independent)
Naomi Armstrong
(DUP)
Stephen McIlveen
(DUP)
Colin Kennedy
(DUP)
May 2022 Co-Options
2019 Nick Mathison
(Alliance)
Jimmy Menagh
(Independent)
2014 Katherine Ferguson
(UUP)
2011 Thomas Hamilton
(UUP)
David Smyth
(UUP)
6 seats
1993-2014
2005 George Ennis
(DUP)
Simon Hamilton
(DUP)
Michelle McIlveen
(DUP)
2001 Hamilton Lawther
(DUP)
Wilbert Magill
(DUP)/
(Independent Unionist)
1997 Bobby McBride
(Independent Unionist)
1993 Nancy Orr
(Independent Unionist)
1989 Owen Dorrian
(Alliance)
Thomas Benson
(UUP)
Simpson Gibson
(DUP)
John Elliott
(DUP)
John Purdy
(Independent Unionist)
1985 William Gilmore
(DUP)
Robert Gaw
(NILP)

2023 Election

2019: 3 x DUP, 2 x Alliance, 1 x UUP, 1 x Independent

2023: 3 x DUP, 2 x Alliance, 1 x UUP, 1 x Independent

2019–2023 Change: No change

Newtownards - 7 seats [3]
PartyCandidateFPv%Count
12345678
Independent Steven Irvine*15.76%1,463       
DUP Naomi Armstrong*14.75%1,370       
UUP Richard Smart*13.54%1,257       
Alliance Alan McDowell*13.31%1,236       
DUP Stephen McIlveen*11.38%1,0571,111.78 1,154.98 1,161.98    
Alliance Vicky Moore*10.20%947959.32 961.42 1,126.21 1,159.33 1,230.97  
DUP Colin Kennedy*6.25%580628.4 764.75 768.49 797.83 798.25 801.43 981.25
TUV Eddie Allen6.44%598670.16 681.26 686.68 700.36 700.72 702.4 872.68
Independent Ian Cox5.68%527618.3 625.5 672.21 685.08 685.56 701.16  
Green (NI) Maurice Macartney2.43%226233.04 234.39      
Independent Ben King0.26%2436.54 36.84      
Electorate: 21,723  Valid: 9,285 (42.74%)  Spoilt: 167  Quota: 1,161  Turnout: 9,452 (43.51%)  

    2019 Election

    2014: 3 x DUP, 2 x UUP, 1 x Alliance, 1 x Independent

    2019: 3 x DUP, 2 x Alliance, 1 x UUP, 1 x Independent

    2014-2019 Change: Alliance gain from UUP

    Newtownards - 7 seats [4]
    PartyCandidateFPv%Count
    1234567
    Independent Jimmy Menagh* †25.63%2,138      
    DUP Naomi Armstrong*14.77%1,232      
    Alliance Nick Mathison 13.08%1,091      
    DUP Stephen McIlveen*10.77%8981,127.1     
    DUP Colin Kennedy6.83%570771.84 919.59 924.07 988.03 1,055.03 
    UUP Richard Smart*8.82%736964.52 970.97 979.45 986.99 1,040.12 1,076.12
    Alliance Alan McDowell*6.88%574668.54 670.19 678.83 679.87 696.66 977.61
    UUP Ian Dickson5.77%481585.98 599.78 602.09 607.29 677.47 734.16
    Green (NI) Maurice Macartney4.49%374448.82 450.47 466.01 467.05 503.97  
    UKIP Paul Corry2.67%223341.32 348.07 358.34 361.2   
    Independent Ben King0.29%2461.12 61.42     
    Electorate: 20,491  Valid: 8,341 (40.71%)  Spoilt: 138  Quota: 1,043  Turnout: 8,479 (41.38%)  

      2014 Election

      This election was carried out under new ward boundaries, as a result of local government reform.

      2011: 2 x DUP, 2 x UUP, 1 x Alliance, 1 x Independent

      2014: 3 x DUP, 2 x UUP, 1 x Alliance, 1 x Independent

      2011-2014: DUP gain due to the addition of one seat

      Newtownards - 7 seats [5]
      PartyCandidateFPv%Count
      123456789
      Independent James Menagh*18.06%1,464        
      DUP Naomi Armstrong*12.94%1,049        
      DUP Stephen McIlveen*10.23%829900.4 907.75 910.3 931.46 946.89 1,016.34  
      DUP Colin Kennedy*6.82%553585.2 591.2 593.6 607.35 618.73 665.55 1,030.55 
      Alliance Alan McDowell*6.64%538554.8 567.15 567.42 578.82 631.22 653.02 659.17 1,074.17
      UUP Richard Smart7.88%639683.1 705.8 706.25 725.35 751.1 807.56 836.74 864.79
      UUP Katherine Ferguson7.34%595631.05 659.10 660.24 681.12 714.9 759.1 811.18 855.85
      TUV David McMullen6.44%522559.8 570.5 570.95 586.4 602.48 647.68 679.45 689.53
      Alliance Linda Cleland*6.11%495512.85 515.85 516.51 530.96 588.66 623.36 634.13  
      DUP John Elliott*5.72%464508.45 512.45 534.26 555.77 565.56 611.51   
      Independent Ian Cox4.74%384470.45 471.45 472.11 542.34 559.39    
      NI21 Nichola Keenan3.10%251263.25 274.25 274.49 288.19     
      Independent Sharon Hunt2.54%206250.8 253.8 254.01      
      NI Conservatives William McKendry1.46%118121.85        
      Electorate: 19,953  Valid: 8,107 (40.63%)  Spoilt: 143  Quota: 1,014  Turnout: 8,250 (41.35%)  

        2011 Election

        2005: 3 x DUP, 2 x UUP, 1 x Alliance

        2011: 2 x DUP, 2 x UUP, 1 x Alliance, 1 x Independent

        2005-2011 Change: Independent gain from DUP

        Newtownards - 6 seats [6]
        PartyCandidateFPv%Count
        1234
        DUP Naomi Armstrong18.31%979   
        Alliance Alan McDowell*16.51%883   
        DUP Stephen McIlveen14.72%787   
        Independent Jimmy Menagh14.29%764772.14  
        UUP Thomas Hamilton *10.45%559573.96 671.06 713.78
        UUP David Smyth*10.53%563567.84 654.94 711.1
        DUP Charlie Simmons7.82%418589.16 639.24 657.96
        TUV Hamilton Lawther3.42%183186.96   
        Independent Ken Richardson2.30%123124.54   
        SDLP Gerard Lennon1.66%8990.32   
        Electorate: 12,092  Valid: 5,348 (44.23%)  Spoilt: 119  Quota: 765  Turnout: 5,467 (45.21%)  

          2005 Election

          2001: 2 x DUP, 2 x UUP, 1 x Alliance, 1 x Independent

          2005: 3 x DUP, 2 x UUP, 1 x Alliance

          2001-2005 Change: DUP gain from Independent

          Newtownards - 6 seats [7]
          PartyCandidateFPv%Count
          1234
          DUP George Ennis *22.66%1,296   
          Alliance Alan McDowell*14.39%823   
          DUP Simon Hamilton 8.57%490840.76  
          DUP Michelle McIlveen 10.89%623652.23 1,005.23 
          UUP Thomas Hamilton *12.87%736766.34 820.7 
          UUP David Smyth*11.38%651660.62 688.91 774.91
          Independent Wilbert Magill*10.56%604617.69 668.09 716.09
          DUP Hamilton Lawther*8.67%496536.33   
          Electorate: 11,945  Valid: 5,719 (47.88%)  Spoilt: 130  Quota: 818  Turnout: 5,849 (48.97%)  

            2001 Election

            1997: 2 x UUP, 2 x Independent Unionist, 1 x DUP, 1 x Alliance

            2001: 2 x DUP, 2 x UUP, 1 x Alliance, 1 x Independent

            1997-2001 Change: DUP gain from Independent Unionist, Independent Unionist becomes Independent

            Newtownards - 6 seats [8]
            PartyCandidateFPv%Count
            12345
            DUP George Ennis *22.81%1,608    
            UUP Thomas Hamilton *18.27%1,288    
            UUP David Smyth*15.04%1,060    
            Independent Wilbert Magill*12.61%889923.2 1,043.2  
            Alliance Alan McDowell*12.18%859863.94 915.32 1,075.9 
            DUP Hamilton Lawther5.15%363838 877.14 944.41 967.66
            DUP Bobby McBride*9.52%671734.46 779.5 830.96 852.04
            Independent Nancy Orr4.43%312322.66    
            Electorate: 12,965  Valid: 7,050 (54.38%)  Spoilt: 218  Quota: 1,008  Turnout: 7,268 (56.06%)  

              1997 Election

              1993: 2 x UUP, 2 x DUP, 1 x Alliance, 1 x Independent Unionist

              1997: 2 x DUP, 2 x Independent Unionist, 1 x DUP, 1 x Alliance

              1993-1997 Change: Independent Unionist gain from DUP

              Newtownards - 6 seats [9]
              PartyCandidateFPv%Count
              123456789
              Ind. Unionist Wilbert Magill*19.41%914        
              Alliance Alan McDowell*15.37%724        
              UUP David Smyth*14.65%690        
              DUP George Ennis *10.89%653692.44       
              UUP Thomas Hamilton *12.00%565628.22 635.8 651.6 656.36 666.68 728.68  
              Ind. Unionist Bobby McBride6.92%326377.33 382.33 388.83 391.38 391.78 426.07 507.6 534.6
              Ind. Unionist Nancy Orr*7.15%337393.26 407.42 430.62 433.68 434.68 461.61 503.67 510.67
              DUP John Purdy4.78%225238.63 245.08 246.28 253.76 254.62 305.39   
              PUP Alfred McCrory4.69%221231.15 245.15 249.45 250.47 250.73    
              Ulster Democratic Billy McKeown1.17%5559.93        
              Electorate: 12,942  Valid: 4,710 (36.39%)  Spoilt: 120  Quota: 673  Turnout: 4,830 (37.32%)  

                1993 Election

                1989: 3 x DUP, 2 x DUP, 1 x Alliance, 1 x Independent Unionist

                1993: 2 x UUP, 2 x DUP, 1 x Alliance, 1 x Independent Unionist

                1989-1993 Change: DUP loss due to the reduction of one seat

                Newtownards - 6 seats [10]
                PartyCandidateFPv%Count
                1234
                UUP David Smyth*17.55%817   
                Alliance Alan McDowell16.49%768   
                Ind. Unionist Nancy Orr13.70%638645.56 695.56 
                UUP Thomas Hamilton 9.84%458551.24 631.1 677.79
                DUP Wilbert Magill*11.90%554567.32 657.3 663.51
                DUP George Ennis 11.71%545549.32 634.22 638.59
                UUP Bobby McBride*10.74%500513.68 546.02 588.34
                DUP John Purdy*4.60%214217.24   
                NI Conservatives Andrew Thompson3.48%162171   
                Electorate: 12,647  Valid: 4,656 (36.82%)  Spoilt: 141  Quota: 666  Turnout: 4,797 (37.93%)  

                  1989 Election

                  1985: 3 x DUP, 2 x UUP, 1 x Alliance, 1 x NILP

                  1989: 3 x DUP, 2 x UUP, 1 x Alliance, 1 x Independent Unionist

                  1985-1989 Change: Independent Unionist gain from NILP

                  Newtownards - 7 seats [11]
                  PartyCandidateFPv%Count
                  123456789
                  UUP Thomas Benson *20.60%1,307        
                  DUP Simpson Gibson *20.22%1,283        
                  Alliance Owen Dorrian*11.33%719757 763.08 770.08 964.08    
                  DUP Wilbert Magill8.64%548565.6 679.98 686.38 686.38 687.38 799.54  
                  DUP John Elliott*6.43%408450.4 625.2 633.1 633.48 634.48 785.14 906.14 
                  UUP David Smyth*7.12%452544 565.66 625.38 628.18 671.18 699.68 794.68 
                  Ind. Unionist John Purdy7.45%473485.4 496.04 503.22 511.82 578.82 585.74 682.36 697.36
                  UUP Thomas Hamilton 2.88%183430.6 449.22 482.58 489.58 525.58 535.06 603.58 636.58
                  Ind. Unionist William Hannigan6.84%434449.6 473.92 478.72 481.12 490.12 504.1   
                  DUP Cedric Wilson 3.59%228236.4 339.38 340.18 342.58 343.58    
                  Alliance Laurence Thompson3.36%213218.2 218.58 221.58      
                  UUP James McKernon1.54%98130.8 136.12       
                  Electorate: 16,907  Valid: 6,346 (37.53%)  Spoilt: 175  Quota: 794  Turnout: 6,521 (38.57%)  

                    1985 Election

                    1985: 3 x DUP, 2 x UUP, 1 x NILP, 1 x Alliance

                    Newtownards - 7 seats [12]
                    PartyCandidateFPv%Count
                    12345678910
                    DUP Simpson Gibson *22.50%1,596         
                    NI Labour Robert Gaw*16.30%1,156         
                    DUP John Elliott*14.47%1,026         
                    UUP Thomas Benson 13.96%990         
                    Alliance Owen Dorrian*7.74%549568.8 638.64 640.07 645.07 666.67 848.2 1,002.2  
                    UUP David Smyth7.29%517552.1 595.06 597.79 613.79 641.15 656.35 665.87 678.87 922.87
                    DUP William Gilmore3.41%242701.9 741.26 845.65 852.15 859.57 860.63 866.49 869.49 891.94
                    DUP Joseph Patterson3.95%280425.35 443.83 458.39 460.79 467.97 470.45 472.65 473.65 489.95
                    UUP David Jeffers3.34%237263.1 301.5 307.48 369.38 412.86 420.88 427.76 443.76  
                    Labour Party NI Hugh McMullan2.65%188190.25 217.85 217.98 218.18 230.86 235.34    
                    Alliance Laurence Thompson2.82%200201.8 214.76 215.15 215.95 219.29     
                    UUP James McKernon1.07%7684.1 89.38 90.94 95.24      
                    Ulster Liberal Michael McGuigan0.49%3536.35 40.43 40.43 40.83      
                    Electorate: 15,487  Valid: 7,092 (45.79%)  Spoilt: 157  Quota: 887  Turnout: 7,249 (46.81%)  

                      Related Research Articles

                      <span class="mw-page-title-main">Strangford (UK Parliament constituency)</span> Parliamentary constituency in the United Kingdom, 1983 onwards

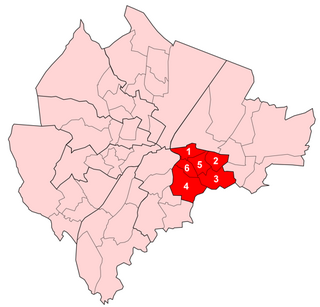
                      Strangford is a parliamentary constituency in the United Kingdom House of Commons. The current MP seat is vacant due to the dissolution of parliament ahead of the 2024 United Kingdom general election.

                      <span class="mw-page-title-main">Castle (District Electoral Area)</span> District Electoral Area in Belfast, Northern Ireland

                      Castle is one of the ten district electoral areas in Belfast, Northern Ireland. Located in the north of the city, the district elects six members to Belfast City Council and contains the wards of Bellevue, Cavehill, Chichester Park, Duncairn, Fortwilliam and Innisfayle. Castle, along with Oldpark district and parts of the Court district and Newtownabbey Borough Council, forms the Belfast North constituency for the Northern Ireland Assembly and UK Parliament. The district is bounded to the east by the Victoria Channel, to the north by Newtownabbey Borough Council and Belfast Lough, to the south by North Street and to the west by the Cavehill Road.

                      <span class="mw-page-title-main">Pottinger (District Electoral Area)</span> Human settlement in Northern Ireland

                      Pottinger was one of the nine district electoral areas (DEA) in Belfast, Northern Ireland from 1985 to 2014. Located in the east of the city, the district elected six members to Belfast City Council and contained the wards of Ballymacarrett, Bloomfield, Orangefield, Ravenhill, The Mount, and Woodstock.

                      <span class="mw-page-title-main">Victoria (District Electoral Area)</span> Electoral division in east Belfast, Northern Ireland

                      Victoria was one of the nine district electoral areas (DEA) in Belfast, Northern Ireland, from 1985 to 2014, when it was mostly replaced by the Ormiston district.

                      Area E was one of the eight district electoral areas (DEA) which existed in Belfast, Northern Ireland from 1973 to 1985. Located in the north-west of the city, the district elected six members to Belfast City Council and contained the wards of Ardoyne; Ballygomartin; Ballysillan; Highfield; Legoniel; and Woodvale. The DEA formed part of the Belfast North and Belfast West constituencies.

                      Elections to Belfast City Council were held on 18 May 1977 on the same day as the other Northern Irish local government elections. The election used nine district electoral areas to elect a total of 51 councillors, most representing the more heavily populated north and west.

                      Elections to Ards Borough Council were held on 5 May 2011 on the same day as the other Northern Irish local government elections. The election used four district electoral areas to elect a total of 23 councillors.

                      <span class="mw-page-title-main">2001 Ards Borough Council election</span> Local government election in Northern Ireland

                      Elections to Ards Borough Council were held on 7 June 2001 on the same day as the other Northern Irish local government elections. The election used four district electoral areas to elect a total of 23 councillors.

                      Elections to Ards Borough Council were held on 21 May 1997 on the same day as the other Northern Irish local government elections. The election used four district electoral areas to elect a total of 23 councillors.

                      Elections to Ards Borough Council were held on 17 May 1989 on the same day as the other Northern Irish local government elections. The election used three district electoral areas to elect a total of 20 councillors.

                      Elections to Ards Borough Council were held on 20 May 1981 on the same day as the other Northern Irish local government elections. The election used three district electoral areas to elect a total of 17 councillors.

                      Elections to Ards Borough Council were held on 18 May 1977 on the same day as the other Northern Irish local government elections. The election used three district electoral areas to elect a total of 17 councillors.

                      <span class="mw-page-title-main">Bangor West (District Electoral Area)</span>

                      Bangor West is one of the seven district electoral areas (DEA) in Ards and North Down, Northern Ireland. The district elects five members to Ards and North Down Borough Council and contains the wards of Bryansburn, Kilcooley, Rathgael, Rathmore and Silverstream. Bangor West forms part of the North Down constituencies for the Northern Ireland Assembly and UK Parliament.

                      <span class="mw-page-title-main">Ards Peninsula (District Electoral Area)</span> District electoral area in Ards and North Down, Northern Ireland

                      Ards Peninsula is one of the seven district electoral areas (DEA) in Ards and North Down, Northern Ireland. The district elects five members to Ards and North Down Borough Council and contains the wards of Ballywalter, Carrowdore, Kircubbin, Loughries, Portaferry and Portavogie. Ards Peninsula forms part of the Strangford constituencies for the Northern Ireland Assembly and UK Parliament.

                      Ards East was one of the four district electoral areas in Ards, Northern Ireland which existed from 1993 to 2014. The district elected six members to Ards Borough Council and formed part of the North Down constituencies for the Northern Ireland Assembly and UK Parliament, and part of the Strangford constituencies for the Northern Ireland Assembly and UK Parliament.

                      Castlereagh East is one of the seven district electoral areas (DEA) in Lisburn and Castlereagh, Northern Ireland. The district elects five members to Lisburn and Castlereagh City Council and contains the wards of Ballyhanwood, Carrowreagh, Dundonald, Enler, Graham's Bridge and Moneyreagh. Castlereagh East forms part of the Belfast East constituencies for the Northern Ireland Assembly and UK Parliament.

                      <span class="mw-page-title-main">Ballyclare (District Electoral Area)</span> District electoral area in Northern Ireland

                      Ballyclare is one of the seven district electoral areas (DEA) in Antrim and Newtownabbey, Northern Ireland. The district elects five members to Antrim and Newtownabbey Borough Council and contains the wards of Ballyclare East, Ballyclare West, Ballynure, Ballyrobert and Doagh. Ballyclare forms part of the South Antrim constituencies for the Northern Ireland Assembly and UK Parliament.

                      Knockagh is one of the seven district electoral areas (DEA) in Mid and East Antrim, Northern Ireland. The district elects five members to Mid and East Antrim District Council and contains the wards of Burleigh Hill, Gortalee, Greenland, Sunnylands and Woodburn. Knockagh forms part of the East Antrim constituencies for the Northern Ireland Assembly and UK Parliament.

                      Ards Area B was one of the three district electoral areas in Ards, Northern Ireland which existed from 1973 to 1985. The district elected six members to Ards Borough Council, and formed part of the North Down constituencies for the Northern Ireland Assembly and UK Parliament.

                      Ards Area C was one of the three district electoral areas in Ards, Northern Ireland which existed from 1973 to 1985. The district elected four members to Ards Borough Council, and formed part of the North Down constituencies for the Northern Ireland Assembly and UK Parliament.

                      References

                      1. Final Northern Ireland super council recommendations, BBC News, 13 December 2013, accessed 24 May 2014
                      2. , ARK, accessed 8 July 2023
                      3. "Local Council Elections 2023 - Results". EONI. Retrieved 8 July 2023.
                      4. "Local Council Elections 2019 - Results by Stage". 2 May 2019. Retrieved 21 January 2022.
                      5. "Local Council Elections 2014 - Results by Stage" . Retrieved 21 January 2022.
                      6. "Newtownards Result Sheet" (PDF). EONI. Retrieved 8 July 2021.
                      7. "Local Government Results 2005". EONI. Retrieved 8 July 2021.
                      8. "Local Government Results 2001". EONI. Retrieved 8 July 2021.
                      9. "Local Government Results 1997". EONI. Retrieved 8 July 2021.
                      10. "Local Government Results 1993". EONI. Retrieved 8 July 2021.
                      11. "Local Government Results 1989". EONI. Retrieved 8 July 2021.
                      12. "Local Government Results 1985". EONI. Retrieved 8 July 2021.