nmon (Nigel's Monitor[2]) is a computer performance system monitor tool for the AIX and Linux operating systems.[3][4] The nmon tool has two modes a) displays the performance stats on-screen in a condensed format or b) the same stats are saved to a comma-separated values (CSV) data file for later graphing and analysis to aid the understanding of computer resource use, tuning options and bottlenecks.
Disk read & write and transfers plus service time and wait times
Disk Groups - decided by the user
Swap and Paging
Network read & write and transfers
Local File-systems
Network File-system (NFS)
Top Processes by CPU use, Memory size and I/O rates
Kernel stats including Run Queue, context-switch, fork, Load Average & Uptime
Large and Huge memory pages
Virtual Machine stats (depending on the hardware) — useful for Linux running KVM to host virtual machines
Resources in the Server and virtual machine
When viewing in on-screen mode the stats displayed are controlled by the user using single letter toggles. For example, "c" to show CPU and then another "c" will switch the CPU stats off. Others include:
nmon -h lists the help and details,
-f or -F to start collecting the stats to a file.
When saving the stats to a file, there is a common default set of stats and then users can request more using command line options. Use nmon -? to display all the options.
The output file can be analyzed with nmon_analyzer.[5]
History
The original nmon version was for the IBM AIX operating system (Release 4.3 and above) and was freely downloadable binary format only tool from the IBM AIX wiki.[6]
Later a version was written for the Linux operating system running on IA-32, x86, x86_64, IBM RS/6000 and POWER processors, Mainframe and ARM (including Raspberry Pi). nmon for Linux was released by IBM as open-source in July 2009. The code is available from the Sourceforge open source repository.[7]
The nmon for AIX code was later bundled in as part of the AIX operating systems. From AIX 5.3 TL09 and AIX 6.1 TL02 onward it was included in the default installation of AIX and fully supported by IBM. The nmon command[8] and the topas command[9] are the same binary but behave differently depending on the command name used.
The two editions (AIX and Linux) have completely different source code but offer many similar features, command line options and data — as much as the underlying operating system allow.
Features
There are two runtime modes available:
In Online Mode it uses curses for efficient screen handling, which updates the terminal frequently for real-time monitoring.
In Capture Mode, the data is saved to a file in CSV format for later processing and graphing. The file also includes important configuration details that are useful for recommending tuning.
nmon concentrates on performance information for the performance tuner and in a concise layout to aid understanding. This includes CPU, memory, disks, adapters, networks, NFS, Kernel statistics, File-systems, Workload Manager (AIX), Workload Partitions (AIX) and Top Processes.
nmon includes support for older AIX releases, Linux running on x86, POWER and Mainframe platforms and other Linux supporting hardware.
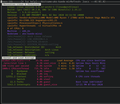
Screenshots
CPU Utilisation and Memory statistics
Resources and Kernel/load average statistics
top Processes sorted by CPU used
Alternatives
On AIX, there is the topas command that can output reports to a file but this is not in a format that can be used easily as a source for a spreadsheet or web tools like RRDtool.
On Linux, there is the top command which is good for CPU and processes but does not cover disks and networks. For disk I/O, the iostat command can give you the details and ntop for network information. But neither of these commands allow saving data in a format suitable for a spreadsheet or simple further processing. Linux utility dstat can be used to produce text data, even in comma separated value format, which is quite suitable for spreadsheet programs.
↑Griffiths, Nigel (February 27, 2006). "IBM Developer". IBM developerWorks. Archived from the original on January 28, 2015. Retrieved January 24, 2015.
This page is based on this Wikipedia article Text is available under the CC BY-SA 4.0 license; additional terms may apply. Images, videos and audio are available under their respective licenses.