Iostat

Last updated

iostat
Iostat macosx.PNG
iostat on an Apple MacBook Pro running Mac OS X, with a single hard disk
Developer(s) AT&T Bell Laboratories
Initial releaseJanuary 1979;41 years ago (1979-01)
Operating system Unix and Unix-like
Type Command

iostat (input/output statistics) is a computer system monitor tool used to collect and show operating system storage input and output statistics. It is often used to identify performance issues with storage devices, including local disks, or remote disks accessed over network file systems such as NFS. It can also be used to provide information about terminal (TTY) input and output, [1] and also includes some basic CPU information.

Contents

Syntax and availability

iostat -x displays output where each line (row) gives numerical data for one device. The first column lists the device name, and subsequent columns show various statistics for that device. Columns include the average service time (svc_t, which includes not only the time a request is in the service queue, but also the seek time and transfer time [2] ), the average busy percentage (%b, essentially the proportion of time that the device is in use), and the percentage of time that the queue is not empty (%w, which means the proportion of time in which requests from the device have not yet been fulfilled). [1]

It is best to run iostat specifying a time interval in seconds (for example iostat -x 30) in order to see the results over time. This is because otherwise, the output will reflect the values over the entire timespan since the system was last rebooted. [2]

The iostat tool is available on most Unix and Unix-like operating systems, such as FreeBSD, macOS (com.apple.pkg.Core package), Linux (sysstat package), and Solaris. The syntax and output of iostat often differs slightly between them. [3]

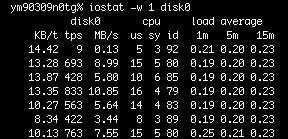
Output of the command

On a Solaris 10 system with numerous attached I/O devices Iostat Solaris 10.PNG
On a Solaris 10 system with numerous attached I/O devices

Sun Microsystems stated that high values in the wait and svc_t fields suggest a lack of overall throughput in the system, indicating that "the system is overloaded with I/O operations". Consistently high values in the kr/s, kw/s, %w and %b fields also indicate "a possible I/O bottleneck". [1]

In versions of Solaris before Solaris 7, iostat can give misleading information in the wait field on multiprocessor systems. This is because iostat can misinterpret one processor being in a state where it is waiting for I/O, as meaning that all processors in the system are having to wait. [2]

It is also advisable to disregard high values in the svc_t field for disks that have very low rates of activity (less than 5%). This is because the fsflush process can force up the average service time when synchronising data on disk with what is in memory. [2]

iostat does not display information about the individual volumes on each disk if a volume manager is used . The vxstat command can be used to show this information instead. [1] In contrast, when using Linux LVM as a volume manager, iostat does display volume information individually, because each logical volume has its own device mapper (dm) device.

See also

Related Research Articles

Operating system software that manages computer hardware resources

An operating system (OS) is system software that manages computer hardware, software resources, and provides common services for computer programs.

troff is the major component of a document processing system developed by AT&T Corporation for the Unix operating system.

In computing, a core dump, crash dump, memory dump, or system dump consists of the recorded state of the working memory of a computer program at a specific time, generally when the program has crashed or otherwise terminated abnormally. In practice, other key pieces of program state are usually dumped at the same time, including the processor registers, which may include the program counter and stack pointer, memory management information, and other processor and operating system flags and information. A snapshot dump is a memory dump requested by the computer operator or by the running program, after which the program is able to continue. Core dumps are often used to assist in diagnosing and debugging errors in computer programs.

man page standard UNIX utility for reading manual pages

A man page is a form of software documentation usually found on a Unix or Unix-like operating system. Topics covered include computer programs, formal standards and conventions, and even abstract concepts. A user may invoke a man page by issuing the man command.

ls command to list files in Unix and Unix-like operating systems

In computing, ls is a command to list computer files in Unix and Unix-like operating systems. ls is specified by POSIX and the Single UNIX Specification. When invoked without any arguments, ls lists the files in the current working directory. The command is also available in the EFI shell. In other environments, such as DOS, OS/2, and Microsoft Windows, similar functionality is provided by the dir command. The numerical computing environments MATLAB and GNU Octave include an ls function with similar functionality.

tcpdump free software

tcpdump is a data-network packet analyzer computer program that runs under a command line interface. It allows the user to display TCP/IP and other packets being transmitted or received over a network to which the computer is attached. Distributed under the BSD license, tcpdump is free software.

tmpfs is a temporary file storage paradigm implemented in many Unix-like operating systems. It is intended to appear as a mounted file system, but data is stored in volatile memory instead of a persistent storage device. A similar construction is a RAM disk, which appears as a virtual disk drive and hosts a disk file system.

In computer storage, logical volume management or LVM provides a method of allocating space on mass-storage devices that is more flexible than conventional partitioning schemes to store volumes. In particular, a volume manager can concatenate, stripe together or otherwise combine partitions into larger virtual partitions that administrators can re-size or move, potentially without interrupting system use.

top (software) (table of processes) task manager program found in many Unix-like operating systems. It produces an ordered list of running processes selected by user-specified criteria, and updates it periodically

top is a task manager program found in many Unix-like operating systems that displays information about CPU and memory utilization.

The fstab file is a system configuration file commonly found at /etc/fstab on Unix and Unix-like computer systems. In Linux it is part of the util-linux package. The fstab file typically lists all available disk partitions and other types of file systems and data sources that are not necessarily disk-based, and indicates how they are to be initialized or otherwise integrated into the larger file system structure.

df is a standard Unix command used to display the amount of available disk space for file systems on which the invoking user has appropriate read access. df is typically implemented using the statfs or statvfs system calls.

netstat command line tool

In computing, netstat is a command-line network utility that displays network connections for Transmission Control Protocol, routing tables, and a number of network interface and network protocol statistics. It is available on Unix-like operating systems including macOS, Linux, Solaris and BSD, and is available on IBM OS/2 and on Microsoft Windows NT-based operating systems including Windows XP, Windows Vista, Windows 7, Windows 8 and Windows 10.

The proc filesystem (procfs) is a special filesystem in Unix-like operating systems that presents information about processes and other system information in a hierarchical file-like structure, providing a more convenient and standardized method for dynamically accessing process data held in the kernel than traditional tracing methods or direct access to kernel memory. Typically, it is mapped to a mount point named /proc at boot time. The proc file system acts as an interface to internal data structures in the kernel. It can be used to obtain information about the system and to change certain kernel parameters at runtime (sysctl).

vmstat is a computer system monitoring tool that collects and displays summary information about operating system memory, processes, interrupts, paging and block I/O. Users of vmstat can specify a sampling interval which permits observing system activity in near-real time.

utmp, wtmp, btmp and variants such as utmpx, wtmpx and btmpx are files on Unix-like systems that keep track of all logins and logouts to the system.

An access method is a function of a mainframe operating system that enables access to data on disk, tape or other external devices. They were introduced in 1963 in IBM OS/360 operating system. Access methods provide an application programming interface (API) for programmers to transfer data to or from device, and could be compared to device drivers in non-mainframe operating systems, but typically provide a greater level of functionality.

In Unix-like operating systems, a device file or special file is an interface to a device driver that appears in a file system as if it were an ordinary file. There are also special files in DOS, OS/2, and Windows. These special files allow an application program to interact with a device by using its device driver via standard input/output system calls. Using standard system calls simplifies many programming tasks, and leads to consistent user-space I/O mechanisms regardless of device features and functions.

sar (Unix) Unix command to collect, report or save system activity information

System Activity Report (sar) is a Unix System V-derived system monitor command used to report on various system loads, including CPU activity, memory/paging, interrupts, device load, network and swap space utilization. Sar uses /procfilesystem for gathering information

Unix family of computer operating systems that derive from the original AT&T Unix

Unix is a family of multitasking, multiuser computer operating systems that derive from the original AT&T Unix, development starting in the 1970s at the Bell Labs research center by Ken Thompson, Dennis Ritchie, and others.

References

  1. 1 2 3 4 Solaris System Performance Management (D.2 ed.), Sun Microsystems Enterprise Services, 2002, pp. 2–10
  2. 1 2 3 4 Cromar, Scott (October 11, 2008), Solaris Troubleshooting Handbook, ISBN   1463512414
  3. Burleson, Donald K. (2002), Oracle9i UNIX administration handbook , McGraw-Hill, p.  320, ISBN   978-0072223040