Related Research Articles
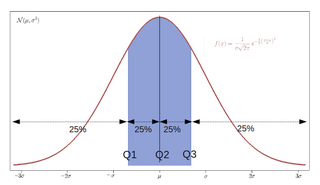
In statistics and probability, quantiles are cut points dividing the range of a probability distribution into continuous intervals with equal probabilities, or dividing the observations in a sample in the same way. There is one fewer quantile than the number of groups created. Common quantiles have special names, such as quartiles, deciles, and percentiles. The groups created are termed halves, thirds, quarters, etc., though sometimes the terms for the quantile are used for the groups created, rather than for the cut points.

In statistics, the standard deviation is a measure of the amount of variation or dispersion of a set of values. A low standard deviation indicates that the values tend to be close to the mean of the set, while a high standard deviation indicates that the values are spread out over a wider range.

In statistics, the standard score is the number of standard deviations by which the value of a raw score is above or below the mean value of what is being observed or measured. Raw scores above the mean have positive standard scores, while those below the mean have negative standard scores.
In statistics, the percentile rank (PR) of a given score is the percentage of scores in its frequency distribution that are less than that score.
In medicine and health-related fields, a reference range or reference interval is the range or the interval of values that is deemed normal for a physiological measurement in healthy persons. It is a basis for comparison for a physician or other health professional to interpret a set of test results for a particular patient. Some important reference ranges in medicine are reference ranges for blood tests and reference ranges for urine tests.

A Z-test is any statistical test for which the distribution of the test statistic under the null hypothesis can be approximated by a normal distribution. Z-tests test the mean of a distribution. For each significance level in the confidence interval, the Z-test has a single critical value which makes it more convenient than the Student's t-test whose critical values are defined by the sample size. Both the Z test and Student's t-test have similarities in that they both help determine the significance of a set of data. However, the z-test is rarely used in practice because the population deviation is difficult to determine.
In statistics, a k-thpercentile, also known as percentile score or centile, is a score below which a given percentage k of scores in its frequency distribution falls or a score at or below which a given percentage falls . Percentiles are expressed in the same unit of measurement as the input scores, not in percent; for example, if the scores refer to human weight, the corresponding percentiles will be expressed in kilograms or pounds.
In statistics, the Mann–Whitney U test is a nonparametric test of the null hypothesis that, for randomly selected values X and Y from two populations, the probability of X being greater than Y is equal to the probability of Y being greater than X.
Stanine is a method of scaling test scores on a nine-point standard scale with a mean of five and a standard deviation of two.
In statistical inference, specifically predictive inference, a prediction interval is an estimate of an interval in which a future observation will fall, with a certain probability, given what has already been observed. Prediction intervals are often used in regression analysis.
A tolerance interval is a statistical interval within which, with some confidence level, a specified proportion of a sampled population falls. "More specifically, a 100×p%/100×(1−α) tolerance interval provides limits within which at least a certain proportion (p) of the population falls with a given level of confidence (1−α)." "A tolerance interval (TI) based on a sample is constructed so that it would include at least a proportion p of the sampled population with confidence 1−α; such a TI is usually referred to as p-content − (1−α) coverage TI." "A upper tolerance limit (TL) is simply a 1−α upper confidence limit for the 100 p percentile of the population."
In probability theory and statistics, the coefficient of variation (CV), also known as relative standard deviation (RSD), is a standardized measure of dispersion of a probability distribution or frequency distribution. It is often expressed as a percentage, and is defined as the ratio of the standard deviation to the mean . The CV or RSD is widely used in analytical chemistry to express the precision and repeatability of an assay. It is also commonly used in fields such as engineering or physics when doing quality assurance studies and ANOVA gauge R&R, by economists and investors in economic models, and in neuroscience.
The Miller Analogies Test (MAT) is a standardized test used both for graduate school admissions in the United States and entrance to high I.Q. societies. Created and still published by Harcourt Assessment, the MAT consists of 120 questions in 60 minutes. Unlike other graduate school admissions exams such as the GRE, the Miller Analogies Test is verbal or computer based.
This glossary of statistics and probability is a list of definitions of terms and concepts used in the mathematical sciences of statistics and probability, their sub-disciplines, and related fields. For additional related terms, see Glossary of mathematics and Glossary of experimental design.
In statistics and applications of statistics, normalization can have a range of meanings. In the simplest cases, normalization of ratings means adjusting values measured on different scales to a notionally common scale, often prior to averaging. In more complicated cases, normalization may refer to more sophisticated adjustments where the intention is to bring the entire probability distributions of adjusted values into alignment. In the case of normalization of scores in educational assessment, there may be an intention to align distributions to a normal distribution. A different approach to normalization of probability distributions is quantile normalization, where the quantiles of the different measures are brought into alignment.
A norm-referenced test (NRT) is a type of test, assessment, or evaluation which yields an estimate of the position of the tested individual in a predefined population, with respect to the trait being measured. Assigning scores on such tests may be described as relative grading, marking on a curve (BrE) or grading on a curve. It is a method of assigning grades to the students in a class in such a way as to obtain or approach a pre-specified distribution of these grades having a specific mean and derivation properties, such as a normal distribution. The term "curve" refers to the bell curve, the graphical representation of the probability density of the normal distribution, but this method can be used to achieve any desired distribution of the grades – for example, a uniform distribution. The estimate is derived from the analysis of test scores and possibly other relevant data from a sample drawn from the population. That is, this type of test identifies whether the test taker performed better or worse than other test takers, not whether the test taker knows either more or less material than is necessary for a given purpose. The term normative assessment is used when the reference population are the peers of the test taker.
Test equating traditionally refers to the statistical process of determining comparable scores on different forms of an exam. It can be accomplished using either classical test theory or item response theory.

In statistics, the 68–95–99.7 rule, also known as the empirical rule, is a shorthand used to remember the percentage of values that lie within an interval estimate in a normal distribution: 68%, 95%, and 99.7% of the values lie within one, two, and three standard deviations of the mean, respectively.
The results for some scales of some psychometric instruments are returned as sten scores, sten being an abbreviation for 'Standard Ten' and thus closely related to stanine scores.
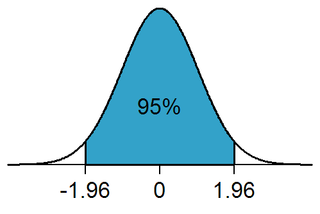
In probability and statistics, the 97.5th percentile point of the standard normal distribution is a number commonly used for statistical calculations. The approximate value of this number is 1.96, meaning that 95% of the area under a normal curve lies within approximately 1.96 standard deviations of the mean. Because of the central limit theorem, this number is used in the construction of approximate 95% confidence intervals. Its ubiquity is due to the arbitrary but common convention of using confidence intervals with 95% probability in science and frequentist statistics, though other probabilities are sometimes used. This convention seems particularly common in medical statistics, but is also common in other areas of application, such as earth sciences, social sciences and business research.
References
- ↑ Mertler, C. A. (2002). Using standardized test data to guide instruction and intervention. College Park, MD: ERIC Clearinghouse on Assessment and Evaluation. (ERIC Document Reproduction Service No. ED470589)
Normal curve equivalent (NCE): A normalized standardized score with a mean of 50 and a standard deviation of 21.06 resulting in a near equal interval scale from 0 to 99. The NCE was developed by RMC Research Corporation in 1976 to measure the effectiveness of the Title I Program across the United States and is often used to measure gains over time. (p. 3)
- ↑ Rochester School Department webpage
- ↑ McLean, J. E., O'Neal, M. R., & Barnette, J. J. (2000, November). Are all effect sizes created equal? Paper presented at the Annual Meeting of the Mid-South Educational Research Association, Bowling Green, KY. (ERIC Document Reproduction Service No. ED448188)