
The 1992 United Kingdom general election was held on Thursday 9 April 1992, to elect 651 members to the House of Commons. The election resulted in the fourth consecutive victory for the Conservative Party since 1979, with a majority of 21 and would be the last time that the Conservatives would win an overall majority at a general election until 2015. It was also the last general election to be held on a day which did not coincide with any local elections until 2017. This election result took many by surprise, as opinion polling leading up to the election day had shown a narrow but consistent lead for the Labour Party under leader Neil Kinnock.

Sheffield Hallam is a constituency represented in the House of Commons of the UK Parliament since 2019 by Olivia Blake of the Labour Party.
Norway elects its legislature on a national level. The parliament, the Storting, has 169 members elected for a four-year term by a form of proportional representation in multi-seat constituencies.

Parliamentary elections were held in Greece on Sunday, 16 September 2007 to elect the 300 members of the Hellenic Parliament. The leading party for a second term was New Democracy under the leadership of Kostas Karamanlis with 42%, followed by George Papandreou and PASOK with 38%. New Democracy managed to secure an absolute but narrow majority of 152 out of 300 seats in parliament. The populist Popular Orthodox Rally entered the parliament for the first time with 10 seats, while the parties of the left, the Communist Party of Greece (KKE) and Syriza, enjoyed a significant increase in their vote share. KKE received 8% of the votes and won 22 seats, while Syriza received 5% of the votes and 14 seats.
In the run-up to the general election of 2010, several polling organisations carried out opinion polling in regards to voting intention in Great Britain. Results of such polls are displayed below.

The 2007 Aragonese regional election was held on Sunday, 27 May 2007, to elect the 7th Cortes of the autonomous community of Aragon. All 67 seats in the Cortes were up for election. The election was held simultaneously with regional elections in 12 other autonomous communities and local elections all throughout Spain.
Nationwide local elections for seats in municipality and county councils were held throughout Norway on 12 September 2011. Several municipalities also opened the polling booths on 11 September. For polling stations this meant that two elections, the municipal elections and the county elections ran concurrently. In addition, an advisory referendum was held in Aust-Agder to determine whether to merge the county with Vest-Agder.

There are five types of elections in the United Kingdom: elections to the House of Commons of the United Kingdom, elections to devolved parliaments and assemblies, local elections, mayoral elections, and police and crime commissioner elections. Within each of those categories, there may also be by-elections. Elections are held on Election Day, which is conventionally a Thursday, and under the provisions of the Dissolution and Calling of Parliament Act 2022 the timing of general elections can be held at the discretion of the prime minister during any five-year period. All other types of elections are held after fixed periods, though early elections to the devolved assemblies and parliaments can occur in certain situations. The five electoral systems used are: the single member plurality system (first-past-the-post), the multi-member plurality, the single transferable vote, the additional member system, and the supplementary vote.
Parliamentary elections were held in Norway on 8 and 9 September 2013 to elect all 169 members of the unicameral Storting. The centre-right coalition obtained 96 seats, while the incumbent red–green coalition government obtained 72 seats and the Green Party obtained one. The Labour Party won the largest share (30.8%) of the votes cast, with the Conservatives coming second (26.8%), after increasing its share by 9.6 percentage points.
In the run up to the 2017 German federal election, various organisations carry out opinion polling to gauge voting intention in Germany. Results of such polls are displayed in this article.

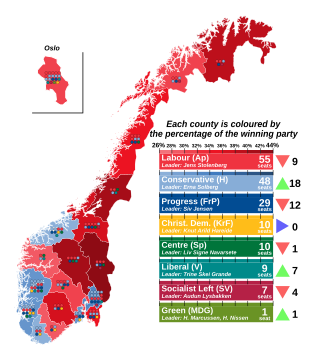
Parliamentary elections were held in Norway on 11 September 2017 to elect all 169 members of the unicameral Norwegian Parliament, the Storting. The non-socialist parties retained a reduced majority of 88 seats, allowing Prime Minister Erna Solberg's Conservative-Progress coalition to remain in government. The Liberal Party joined the coalition in January 2018 but it remained a minority cabinet until the Christian Democratic Party joined the coalition in 2019. The three largest centre-left parties won 79 seats. The Green Party retained its single seat, while the Red Party won its first ever seat.

The 2015 United Kingdom general election was held on Thursday 7 May 2015 to elect 650 Members of Parliament to the House of Commons. It was the only general election held under the rules of the Fixed-term Parliaments Act 2011 and was the last general election to be held before the United Kingdom would vote to end its membership of the European Union (EU). Local elections took place in most areas of England on the same day.
In the run-up to the general election on 8 June 2017, various organisations carried out opinion polling to gauge voting intentions. Results of such polls are displayed in this article. Most of the polling companies listed are members of the British Polling Council (BPC) and abide by its disclosure rules.

The 1987 Asturian regional election was held on Wednesday, 10 June 1987, to elect the 2nd General Junta of the Principality of Asturias. All 45 seats in the General Junta were up for election. The election was held simultaneously with regional elections in twelve other autonomous communities and local elections all throughout Spain, as well as the 1987 European Parliament election.

The Himachal Pradesh Legislative Assembly election, 2017 was held on 9 November 2017 to elect all 68 members of the Himachal Pradesh Legislative Assembly.
At various dates in the run up to the 2019 general election, various organisations carried out opinion polling to gauge the opinions that voters hold towards political leaders. Results of such polls are displayed in this article. Most of the polling companies listed are members of the British Polling Council (BPC) and abide by its disclosure rules.
In the run up to the 2021 Norwegian parliamentary election, various organisations carried out opinion polling to gauge voting intention in Norway. Results of such polls are displayed in this article.
In the run up to the 2023 Estonian parliamentary election, various organisations carried out opinion polling to gauge voting intention in Estonia. The date range for these opinion polls are from the 2019 Estonian parliamentary election held on 3 March. Poll results are listed in the table below in reverse chronological order, showing the most recent first. The highest percentage figure in each poll is displayed in bold, and the background shaded in the leading party's colour. In the instance that there is a tie, then no figure is shaded.
In the run up to the 2021 Icelandic parliamentary election, various organisations carried out opinion polling to gauge voting intention in Iceland during the term of the Althing. This article lists the results of such polls. The date range for these opinion polls is from the previous election, held on 28 October 2017, to the present day.
In the run up to the 2025 Norwegian parliamentary election, various organisations carry out opinion polling to gauge voting intention in Norway. The date range for these opinion polls are from the 2021 Norwegian parliamentary election, held on 13 September, to the present day. Unlike most nations, Norway's constitution does not allow early elections before the four-year term limit.
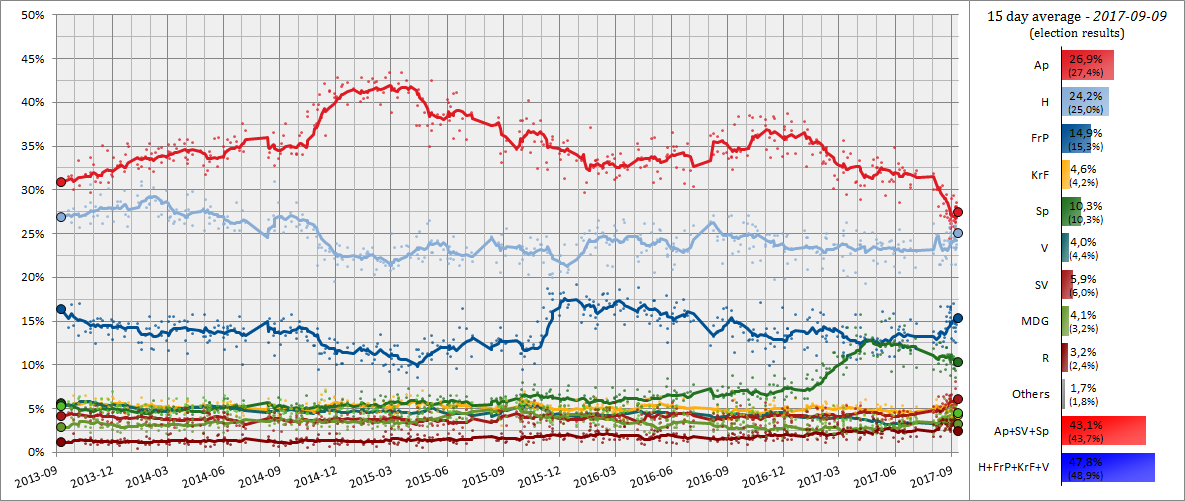 30 day moving average of poll results since the 2013 election, with each line corresponding to a political party.
 Longer term polling results based on monthly averages from pollofpolls.
 Zoom on the smaller parties.
