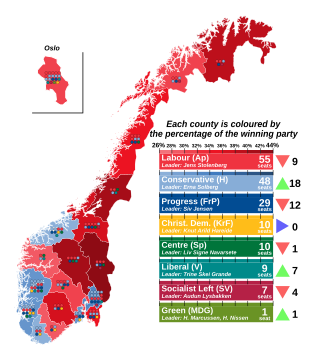
Poll results
Graphical summary
There were several websites tracking party support ahead of the election, using somewhat different methods. [1] [2] Below is a plot of the 30-day moving average of relevant opinion polls.

2021
| Polling firm | Fieldwork date | Sample size | Resp. | R | SV | MDG | Ap | Sp | V | KrF | H | FrP | Others | Lead |
|---|---|---|---|---|---|---|---|---|---|---|---|---|---|---|
| 2021 election | 13 Sep 2021 | — | 77.2 | 4.7 | 7.6 | 3.9 | 26.3 | 13.5 | 4.6 | 3.8 | 20.4 | 11.6 | 3.6 [lower-alpha 1] | 5.9 |
| Kantar TNS | 9–11 Sep 2021 | 2,088 | – | 5.7 | 8.7 | 5.1 | 24.6 | 12.7 | 4.5 | 3.8 | 19.0 | 12.3 | 3.6 | 5.6 |
| Opinion Perduco | 10 Sep 2021 [lower-alpha 2] | – | – | 4.6 | 7.7 | 4.8 | 26.9 | 14.8 | 4.5 | 3.3 | 18.9 | 11.9 | 2.5 | 8.0 |
| Kantar TNS | 8–10 Sep 2021 | 2,388 | 83.6 | 5.9 | 9.1 | 4.9 | 24.5 | 13.2 | 4.4 | 4.2 | 19.4 | 11.3 | 3.3 | 5.1 |
| Kantar TNS | 7–9 Sep 2021 | 2,387 | 81.4 | 6.7 | 9.2 | 4.7 | 23.9 | 12.7 | 4.8 | 4.9 | 19.1 | 10.9 | 3.3 | 4.8 |
| Norfakta | 7–8 Sep 2021 | 1,003 | 84.0 | 5.4 | 8.2 | 5.9 | 24.0 | 14.8 | 3.8 | 3.6 | 19.1 | 11.8 | 3.5 | 4.9 |
| Ipsos MMI | 6–8 Sep 2021 | – | – | 6.0 | 11.8 | 4.3 | 22.9 | 12.2 | 6.1 | 4.2 | 17.0 | 11.8 | 3.7 | 5.9 |
| Norstat | 4–8 Sep 2021 | – | – | 4.6 | 9.0 | 4.9 | 24.6 | 11.6 | 5.8 | 3.9 | 18.8 | 11.9 | 4.9 | 5.8 |
| Respons Analyse | 3–8 Sep 2021 | 1,000 | – | 6.0 | 9.4 | 4.2 | 26.6 | 11.1 | 3.9 | 4.5 | 18.0 | 12.4 | 3.9 | 8.6 |
| Kantar TNS | 3–8 Sep 2021 | 2,582 | – | 6.4 | 9.3 | 4.7 | 23.7 | 13.4 | 4.6 | 4.5 | 19.1 | 11.2 | 3.5 [lower-alpha 3] | 4.6 |
| Norstat | 31 Aug–8 Sep 2021 | 11,500 | – | 4.9 | 8.9 | 4.9 | 24.7 | 11.9 | 4.9 | 4.2 | 20.4 | 12.0 | 3.1 | 4.3 |
| Kantar TNS | 1–7 Sep 2021 | 2,184 | – | 6.2 | 8.9 | 5.0 | 23.8 | 13.8 | 4.8 | 4.3 | 18.6 | 11.1 | 3.5 [lower-alpha 4] | 5.2 |
| Kantar TNS | 1–6 Sep 2021 | 1,686 | – | 5.6 | 9.5 | 4.7 | 23.3 | 14.0 | 4.7 | 4.1 | 19.4 | 10.9 | 3.8 [lower-alpha 5] | 3.9 |
| Norstat | 30 Aug–6 Sep 2021 | 969 | – | 5.2 | 8.6 | 5.4 | 23.9 | 14.3 | 3.6 | 3.4 | 18.5 | 12.4 | 4.7 | 5.4 |
| Kantar TNS | 25 Aug–3 Sep 2021 | 1,388 | – | 5.4 | 9.4 | 4.3 | 23.4 | 14.0 | 4.6 | 3.6 | 20.5 | 10.0 | 4.9 [lower-alpha 6] | 2.9 |
| Kantar TNS | 27 Aug–2 Sep 2021 | 1,480 | – | 5.1 | 9.5 | 5.0 | 23.2 | 12.4 | 4.8 | 4.3 | 21.2 | 9.0 | 5.4 | 2.0 |
| Respons Analyse | 27 Aug–1 Sep 2021 | 1,000 | 81.0 | 4.6 | 10.4 | 4.9 | 23.2 | 12.6 | 5.5 | 3.6 | 20.1 | 11.5 | 3.6 | 3.1 |
| Kantar TNS | 25–31 Aug 2021 | 1,200 | – | 4.9 | 9.7 | 5.0 | 23.4 | 11.0 | 4.8 | 4.1 | 21.5 | 10.7 | 4.9 [lower-alpha 7] | 1.9 |
| Norstat | 23–29 Aug 2021 | – | – | 5.0 | 10.6 | 4.8 | 23.1 | 12.2 | 4.5 | 4.7 | 19,6 | 11.3 | 3.9 | 3.5 |
| Norstat | 24–28 Aug 2021 | 962 | – | 5.4 | 10.0 | 5.8 | 23.7 | 12.6 | 4.9 | 3.7 | 19.0 | 11.5 | 3.4 | 4.7 |
| Kantar TNS | 23–27 Aug 2021 | 996 | – | 7.2 | 10.2 | 5.0 | 22.6 | 11.5 | 4.4 | 3.8 | 19.2 | 11.8 | 4.3 [lower-alpha 8] | 3.4 |
| Kantar TNS | 22–25 Aug 2021 | – | – | 6.3 | 9.9 | 5.3 | 22.4 | 11.2 | 4.8 | 3.7 | 20.5 | 10.7 | 5.2 | 1.9 |
| Sentio | 17–21 Aug 2021 | 1,000 | – | 5.4 | 8.8 | 7.2 | 23.9 | 13.2 | 3.8 | 3.9 | 19.1 | 9.8 | 4.9 | 4.8 |
| Norstat | 16–22 Aug 2021 | – | – | 4.7 | 9.5 | 5.3 | 26.8 | 12.8 | 3.8 | 3.6 | 18.9 | 10.5 | 4.2 | 7.9 |
| Kantar TNS | 16–20 Aug 2021 | 992 | 81.7 | 5.9 | 9.5 | 5.1 | 22.7 | 13.0 | 4.4 | 3.4 | 19.7 | 9.3 | 7.0 [lower-alpha 9] | 3.0 |
| Respons Analyse | 13–18 Aug 2021 | 1,001 | – | 4.7 | 9.5 | 5.8 | 24.9 | 11.3 | 5.0 | 4.2 | 20.3 | 11.6 | 2.7 | 4.6 |
| Norstat | 10–13 Aug 2021 | 948 | – | 3.2 | 7.6 | 6.7 | 22.1 | 17.1 | 4.1 | 2.9 | 21.9 | 8.6 | 5.8 | 0.2 |
| Kantar TNS | 9–13 Aug 2021 | 983 | – | 5.1 | 9.3 | 6.3 | 22.8 | 13.7 | 3.4 | 5.1 | 21.2 | 7.7 | 5.6 | 1.6 |
| Norstat | 28 Jul–11 Aug 2021 | 11,400 | – | 4.9 | 6.9 | 4.3 | 25.5 | 16.2 | 3.3 | 3.1 | 21.1 | 10.9 | 3.9 | 4.4 |
| Norstat | 6–11 Aug 2021 | 1,000 | 79.0 | 4.6 | 8.6 | 5.9 | 24.0 | 16.1 | 4.3 | 3.2 | 19.1 | 10.1 | 4.1 | 4.9 |
| Respons Analyse | 5–11 Aug 2021 | 1,000 | – | 4.3 | 9.4 | 5.1 | 24.8 | 15.3 | 4.0 | 3.3 | 18.9 | 11.4 | 3.5 | 5.9 |
| Opinion Perduco | 3–8 Aug 2021 | 964 | 76.0 | 3.8 | 8.8 | 3.5 | 22.6 | 19.2 | 3.8 | 4.0 | 21.2 | 9.3 | 3.8 | 1.4 |
| Kantar TNS | 2–6 Aug 2021 | 977 | - | 7.5 | 8.6 | 4.5 | 23.5 | 16.4 | 3.2 | 3.8 | 18.2 | 9.3 | 5.0 | 5.3 |
| Norstat | 22–28 Jul 2021 | 1,000 | 74.0 | 5.5 | 8.0 | 4.1 | 26.9 | 15.0 | 3.6 | 3.0 | 19.5 | 11.6 | 2.8 | 7.4 |
| Norfakta | 6–7 Jul 2021 | 1,000 | 77.0 | 6.0 | 8.8 | 3.9 | 23.8 | 16.9 | 4.0 | 3.1 | 20.2 | 10.3 | 3.0 | 3.6 |
| Kantar TNS | 28 Jun–2 Jul 2021 | 982 | – | 5.4 | 7.3 | 4.9 | 22.4 | 19.1 | 2.8 | 3.8 | 19.7 | 10.6 | 4.1 | 2.7 |
| Ipsos MMI | 28–30 Jun 2021 | 1,000 | – | 5.5 | 6.6 | 5.0 | 23.9 | 19.3 | 3.4 | 2.7 | 20.7 | 7.2 | 5.7 [lower-alpha 10] | 3.2 |
| Norstat | 17–23 Jun 2021 | 1,000 | 75.0 | 4.9 | 8.8 | 4.2 | 27.0 | 15.0 | 2.5 | 3.5 | 21.1 | 9.4 | 3.5 | 5.9 |
| Norstat | 15–20 Jun 2021 | 930 | – | 5.8 | 8.4 | 2.8 | 24.9 | 17.5 | 2.6 | 2.7 | 22.1 | 9.6 | 3.5 | 2.8 |
| Respons Analyse | 9–14 Jun 2021 | 1.000 | – | 4.5 | 8.2 | 3.7 | 23.6 | 18.2 | 2.8 | 3.3 | 21.4 | 10.5 | 3.7 | 2.2 |
| Sentio | 8–13 Jun 2021 | 1,000 | – | 4.8 | 7.0 | 5.0 | 23.9 | 18.7 | 2.8 | 3.3 | 21.9 | 10.1 | 2.4 | 2.0 |
| Norstat | 26 May–11 Jun 2021 | 11,400 | – | 4.2 | 7.8 | 3.7 | 24.1 | 17.7 | 2.7 | 3.6 | 23.0 | 10.2 | 3.2 | 1.1 |
| Opinion Perduco | 1–7 Jun 2021 | 964 | 74.0 | 4.7 | 6.1 | 4.7 | 24.3 | 18.7 | 2.3 | 3.7 | 22.8 | 10.3 | 2.5 | 1.5 |
| Norfakta | 31 May–4 Jun 2021 | – | – | 5.6 | 8.1 | 4.0 | 23.5 | 17.6 | 2.9 | 2.9 | 22.3 | 10.9 | 2.3 | 1.2 |
| Norstat | 25–31 May 2021 | 953 | – | 5.9 | 7.3 | 4.2 | 24.7 | 17.0 | 3.1 | 3.0 | 21.2 | 10.7 | 3.0 | 3.3 |
| Kantar TNS | 25–31 May 2021 | 1,179 | – | 6.5 | 8.5 | 4.5 | 24.5 | 17.5 | 4.1 | 3.4 | 18.2 | 9.8 | 2.7 | 6.5 |
| Ipsos MMI | 24–26 May 2021 | 1,000 | 74.0 | 4.0 | 7.6 | 4.7 | 25.7 | 16.4 | 2.6 | 3.3 | 21.1 | 10.1 | 4.5 | 4.6 |
| Norstat | 18–25 May 2021 | 967 | – | 4.9 | 7.5 | 2.6 | 25.0 | 16.2 | 2.7 | 3.6 | 23.7 | 9.9 | 4.0 | 1.3 |
| Norstat | 20–24 May 2021 | 999 | – | 3.9 | 7.8 | 5.3 | 24.5 | 16.2 | 3.2 | 2.9 | 22.8 | 10.9 | 2.6 | 1.7 |
| Sentio | 11–16 May 2021 | 1,000 | – | 4.6 | 7.3 | 5.1 | 25.3 | 14.6 | 3.4 | 3.8 | 22.1 | 12.0 | 1.7 | 3.2 |
| Opinion Perduco | 13 May 2021 [lower-alpha 2] | – | – | 4.4 | 9.3 | 5.0 | 25.6 | 16.3 | 3.3 | 4.1 | 22.0 | 8.7 | 1.4 | 3.6 |
| Respons Analyse | 5–10 May 2021 | 1,001 | – | 4.0 | 8.0 | 4.2 | 21.5 | 18.3 | 3.6 | 4.1 | 22.0 | 10.8 | 3.5 | 0.5 |
| Norfakta | 4–5 May 2021 | 1,000 | – | 4.2 | 8.0 | 3.8 | 24.4 | 14.8 | 3.9 | 3.9 | 23.9 | 10.0 | 3.1 | 0.5 |
| Norstat | 27 April–3 May 2021 | 958 | – | 4.4 | 8.8 | 4.0 | 23.1 | 17.5 | 3.1 | 4.2 | 21.1 | 11.3 | 2.4 | 2.0 |
| Kantar TNS | 26–30 Apr 2021 | 976 | – | 4.6 | 8.1 | 2.1 | 21.1 | 18.4 | 4.1 | 4.5 | 24.3 | 8.6 | 4.1 | 3.2 |
| Ipsos MMI | 26–28 Apr 2021 | 1,000 | 73.0 | 4.5 | 8.5 | 3.9 | 23.5 | 17.5 | 3.7 | 4.0 | 20.4 | 9.5 | 4.5 | 3.1 |
| Norstat | 20–24 Apr 2021 | 963 | – | 3.7 | 7.4 | 3.6 | 25.6 | 17.8 | 3.1 | 3.8 | 21.8 | 10.0 | 3.2 | 3.8 |
| Norstat | 7–20 Apr 2021 | 11,413 | – | 3.7 | 7.0 | 3.9 | 23.3 | 17.1 | 2.9 | 3.4 | 24.7 | 11.1 | 3.0 | 1.4 |
| Sentio | 13–19 Apr 2021 | 1,000 | – | 4.1 | 7.3 | 4.4 | 24.8 | 17.1 | 2.9 | 3.1 | 24.1 | 10.0 | 2.1 | 0.7 |
| Opinion Perduco | 14 Apr 2021 [lower-alpha 2] | – | – | 4.0 | 7.7 | 5.7 | 23.1 | 19.0 | 3.3 | 3.1 | 21.7 | 9.5 | 3.0 | 1.4 |
| Respons Analyse | 7–12 Apr 2021 | 1,000 | 75.0 | 4.8 | 7.7 | 4.4 | 25.4 | 14.0 | 3.2 | 3.2 | 26.6 | 8.3 | 2.4 | 1.2 |
| Norfakta | 6–7 Apr 2021 | 1,000 | 74.0 | 4.0 | 9.8 | 4.1 | 22.5 | 18.8 | 1.9 | 2.4 | 24.2 | 10.5 | 1.7 | 1.7 |
| Kantar TNS | 29 Mar–7 Apr 2021 | 1,002 | – | 4.0 | 8.4 | 4.3 | 20.6 | 18.7 | 2.3 | 4.1 | 24.2 | 10.2 | 2.7 | 3.6 |
| Norstat | 23–28 Mar 2021 | 968 | – | 3.8 | 6.9 | 4.9 | 23.3 | 16.6 | 4.0 | 3.2 | 25.2 | 10.2 | 1.8 | 1.9 |
| Ipsos MMI | 22–24 Mar 2021 | 1,000 | 77.0 | 4.9 | 7.4 | 3.4 | 24.3 | 16.7 | 2.9 | 2.9 | 20.9 | 11.5 | 5.1 | 3.4 |
| Norstat | 16–21 Mar 2021 | 961 | – | 4.1 | 7.5 | 3.3 | 20.5 | 20.5 | 2.4 | 4.1 | 23.8 | 9.9 | 4.1 | 3.3 |
| Sentio | 9–14 Mar 2021 | 1,000 | – | 4.1 | 7.8 | 3.3 | 23.5 | 18.6 | 2.9 | 2.4 | 22.7 | 12.0 | 2.7 | 0.8 |
| Respons Analyse | 5–10 Mar 2021 | 1,001 | – | 4.7 | 7.7 | 3.6 | 22.2 | 18.6 | 3.3 | 2.5 | 27.8 | 7.8 | 1.8 | 5.6 |
| Opinion Perduco | 1–8 Mar 2021 | 966 | 72.0 | 4.9 | 7.8 | 4.1 | 22.7 | 20.7 | 2.2 | 2.9 | 22.8 | 9.2 | 2.6 | 0.1 |
| Norfakta | 2–3 Mar 2021 | 1,000 | – | 3.8 | 7.5 | 3.5 | 24.3 | 17.7 | 3.9 | 2.7 | 23.9 | 10.0 | 2.9 | 0.4 |
| Norstat | 22–28 Feb 2021 | 957 | – | 2.8 | 7.4 | 3.9 | 21.0 | 22.2 | 2.8 | 3.9 | 24.6 | 9.7 | 1.6 | 2.4 |
| Kantar TNS | 22–26 Feb 2021 | 981 | – | 6.8 | 8.6 | 4.0 | 18.2 | 19.2 | 2.9 | 3.3 | 25.6 | 7.2 | 4.2 | 6.4 |
| Ipsos MMI | 22–24 Feb 2021 | 1,000 | 75.5 | 2.7 | 7.8 | 3.7 | 20.3 | 17.7 | 4.6 | 3.3 | 23.1 | 12.9 | 3.9 | 2.8 |
| Norstat | 15–21 Feb 2021 | 961 | – | 4.8 | 6.1 | 5.2 | 20.6 | 18.6 | 2.3 | 3.6 | 27.6 | 8.3 | 3.0 | 7.0 |
| Sentio | 9–14 Feb 2021 | 1,000 | – | 3.8 | 8.6 | 4.7 | 21.0 | 18.4 | 2.7 | 3.3 | 26.9 | 7.5 | 3.0 | 5.9 |
| Opinion Perduco | 1–8 Feb 2021 | 964 | – | 2.9 | 7.4 | 4.0 | 24.6 | 19.1 | 3.2 | 3.2 | 25.1 | 8.1 | 2.5 | 0.5 |
| Norfakta | 2–3 Feb 2021 | 1,000 | – | 3.8 | 7.5 | 5.0 | 21.3 | 19.7 | 4.0 | 2.7 | 27.3 | 6.4 | 2.3 | 6.0 |
| Respons Analyse | 27 Jan–2 Feb 2021 | 1,000 | – | 4.2 | 7.3 | 3.8 | 22.8 | 18.8 | 1.9 | 3.4 | 26.3 | 8.7 | 2.8 | 3.5 |
| Norstat | 25–31 Jan 2021 | 945 | 74.7 | 3.9 | 8.3 | 4.8 | 20.7 | 21.9 | 2.4 | 3.5 | 22.8 | 8.3 | 3.3 | 0.9 |
| Kantar TNS | 25–29 Jan 2021 | 974 | 76.2 | 5.2 | 5.9 | 5.0 | 20.0 | 19.9 | 4.2 | 2.8 | 25.3 | 7.7 | 4.1 | 5.3 |
| Ipsos MMI | 25–27 Jan 2021 | 1,000 | 73.4 | 5.3 | 7.7 | 1.8 | 20.4 | 21.4 | 2.5 | 2.9 | 25.4 | 9.5 | 3.1 | 4.0 |
| Norstat | 18–24 Jan 2021 | 954 | – | 3.8 | 7.6 | 3.0 | 24.2 | 19.6 | 1.6 | 2.7 | 25.6 | 10.0 | 1.9 | 1.4 |
| Sentio | 12–16 Jan 2021 | 1,000 | – | 3.3 | 7.8 | 6.4 | 21.3 | 19.6 | 2.6 | 2.9 | 23.0 | 8.4 | 4.6 | 1.8 |
| InFact | 13 Jan 2021 | 3,245 | – | 4.0 | 8.7 | 5.8 | 18.4 | 20.5 | 2.1 | 4.7 | 24.1 | 8.6 | 3.1 | 3.6 |
| Opinion Perduco | 13 Jan 2021 [lower-alpha 2] | – | – | 4.4 | 8.0 | 3.4 | 19.0 | 20.1 | 2.7 | 3.4 | 26.9 | 9.8 | 2.3 | 6.8 |
| Kantar TNS | 4–8 Jan 2021 | 976 | – | 5.3 | 7.6 | 3.4 | 22.4 | 21.7 | 2.3 | 3.3 | 24.2 | 7.4 | 2.2 | 1.8 |
| Norfakta | 5–6 Jan 2021 | 1,001 | 78.0 | 3.1 | 8.2 | 4.5 | 17.5 | 22.6 | 2.7 | 3.4 | 24.3 | 11.1 | 2.6 | 1.7 |
| Respons Analyse | 4–6 Jan 2021 | 1,000 | – | 3.4 | 7.7 | 3.8 | 20.5 | 19.2 | 3.4 | 3.4 | 26.5 | 9.3 | 2.8 | 6.0 |
| Norstat | 28 Dec 2020–2 Jan 2021 | 962 | – | 3.7 | 8.9 | 3.9 | 20.1 | 21.3 | 2.5 | 3.7 | 22.6 | 11.3 | 2.0 | 1.3 |
| 2017 election | 11 Sep 2017 | — | 78.3 | 2.4 | 6.0 | 3.2 | 27.4 | 10.3 | 4.4 | 4.2 | 25.0 | 15.2 | 1.7 | 2.4 |
2020
| Polling firm | Fieldwork date | Sample size | Resp. | R | SV | MDG | Ap | Sp | V | KrF | H | FrP | Others | Lead |
|---|---|---|---|---|---|---|---|---|---|---|---|---|---|---|
| Ipsos MMI | 14–16 Dec 2020 | 1,000 | 73.2 | 3.7 | 7.5 | 3.9 | 21.1 | 22.3 | 3.5 | 3.8 | 18.9 | 12.9 | 2.4 | 1.2 |
| Norstat | 7–13 Dec 2020 | 952 | – | 3.3 | 8.0 | 3.8 | 21.4 | 21.3 | 3.1 | 3.8 | 21.8 | 12.1 | 1.4 | 0.4 |
| Opinion Perduco | 1–7 Dec 2020 | 962 | 72.0 | 3.8 | 6.9 | 4.5 | 21.8 | 22.2 | 2.4 | 3.4 | 22.9 | 10.9 | 1.3 | 0.7 |
| Norfakta | 1–2 Dec 2020 | 1,000 | 81.0 | 4.1 | 7.1 | 4.3 | 21.1 | 20.1 | 2.9 | 2.6 | 23.0 | 12.4 | 2.4 | 1.9 |
| Kantar TNS | 24–30 Nov 2020 | 984 | 81.0 | 6.4 | 8.1 | 4.0 | 20.4 | 22.1 | 4.0 | 3.3 | 20.2 | 8.8 | 2.8 | 1.7 |
| Respons Analyse | 25–30 Nov 2020 | 1,000 | – | 3.7 | 8.1 | 4.5 | 20.3 | 20.5 | 4.1 | 3.8 | 22.9 | 10.9 | 1.2 | 2.4 |
| Sentio | 24–29 Nov 2020 | 1,000 | – | 4.0 | 7.0 | 4.0 | 22.4 | 18.4 | 2.9 | 3.4 | 26.5 | 8.8 | 2.6 | 4.1 |
| Ipsos MMI | 16–18 Nov 2020 | 1,000 | 70.2 | 3.1 | 7.4 | 5.3 | 21.5 | 18.6 | 4.6 | 3.4 | 20.4 | 11.9 | 3.8 | 1.1 |
| Norstat | 9–15 Nov 2020 | 952 | – | 4.0 | 7.4 | 4.2 | 20.9 | 19.3 | 3.0 | 2.9 | 21.9 | 12.6 | 3.7 | 1.0 |
| Opinion Perduco | 3–9 Nov 2020 | 969 | – | 4.2 | 8.1 | 5.0 | 20.4 | 17.8 | 3.4 | 4.2 | 24.6 | 10.9 | 1.5 | 4.2 |
| Norfakta | 3–4 Nov 2020 | 1,000 | – | 4.1 | 6.7 | 4.0 | 23.4 | 17.7 | 2.5 | 3.4 | 24.7 | 11.2 | 2.3 | 1.3 |
| Sentio | 27 Oct–3 Nov 2020 | 1,000 | – | 3.4 | 7.6 | 3.5 | 21.9 | 16.4 | 3.0 | 4.2 | 25.0 | 13.4 | 1.7 | 3.1 |
| Respons Analyse | 28–31 Oct 2020 | 1,000 | – | 4.1 | 5.7 | 4.9 | 22.0 | 18.9 | 3.9 | 3.5 | 21.6 | 13.9 | 1.5 | 0.4 |
| Kantar TNS | 26–30 Oct 2020 | 986 | 79.2 | 4.9 | 7.8 | 4.0 | 20.5 | 19.8 | 4.1 | 2.8 | 22.1 | 11.5 | 2.5 | 1.6 |
| Norstat | 20–25 Oct 2020 | 942 | 75.0 | 3.3 | 7.9 | 4.3 | 23.5 | 14.9 | 3.3 | 3.3 | 25.2 | 12.3 | 2.2 | 1.7 |
| Ipsos MMI | 19–21 Oct 2020 | 1,000 | 72.6 | 5.4 | 6.3 | 4.7 | 19.5 | 17.8 | 2.6 | 3.7 | 22.3 | 12.7 | 5.0 | 2.8 |
| Norstat | 12–18 Oct 2020 | 962 | – | 4.1 | 6.0 | 3.7 | 23.5 | 16.6 | 3.0 | 3.4 | 24.3 | 13.2 | 2.1 | 0.8 |
| Sentio | 6–12 Oct 2020 | 1,000 | – | 3.3 | 6.6 | 4.2 | 20.8 | 19.8 | 3.3 | 3.5 | 23.6 | 13.5 | 1.4 | 2.8 |
| Norfakta | 6–7 Oct 2020 | 1,001 | 77.0 | 4.4 | 6.6 | 5.6 | 21.0 | 17.0 | 3.9 | 3.4 | 22.9 | 13.1 | 2.0 | 1.9 |
| Opinion Perduco | 29 Sep–4 Oct 2020 | 955 | – | 4.6 | 7.3 | 3.1 | 22.0 | 14.2 | 4.2 | 2.9 | 27.4 | 12.5 | 1.8 | 5.4 |
| Kantar TNS | 28 Sep–2 Oct 2020 | 974 | 73.2 | 6.1 | 7.2 | 4.7 | 18.4 | 16.2 | 4.3 | 5.1 | 24.0 | 12.8 | 1.1 | 5.6 |
| Respons Analyse | 28–30 Sep 2020 | 1,001 | – | 4.3 | 8.1 | 4.6 | 22.7 | 14.0 | 3.6 | 3.1 | 26.5 | 11.6 | 1.5 | 3.8 |
| Norstat | 21–27 Sep 2020 | 956 | 72.8 | 5.2 | 7.1 | 4.9 | 21.7 | 13.1 | 3.6 | 3.0 | 24.1 | 14.4 | 2.9 | 2.4 |
| Ipsos MMI | 21–25 Sep 2020 | 713 | – | 3.6 | 8.4 | 3.5 | 22.4 | 15.2 | 3.6 | 4.6 | 22.7 | 13.9 | 2.4 | 0.3 |
| Norstat | 14–20 Sep 2020 | 948 | – | 3.4 | 7.8 | 4.2 | 22.6 | 14.3 | 3.2 | 4.1 | 25.3 | 13.3 | 1.8 | 2.7 |
| Sentio | 8–14 Sep 2020 | 1,000 | – | 4.0 | 7.2 | 4.3 | 21.8 | 14.6 | 2.6 | 3.5 | 24.8 | 14.7 | 2.4 | 3.0 |
| Opinion Perduco | 1–7 Sep 2020 | 975 | – | 4.4 | 6.9 | 7.5 | 19.9 | 16.0 | 2.5 | 3.9 | 27.0 | 10.3 | 1.7 | 7.1 |
| Norfakta | 1–2 Sep 2020 | 1,000 | 78.0 | 3.3 | 8.1 | 3.5 | 24.7 | 13.4 | 2.9 | 4.1 | 25.6 | 12.8 | 1.6 | 0.9 |
| Kantar TNS | 25 Aug–1 Sep 2020 | 1,182 | 79.6 | 5.5 | 9.6 | 5.7 | 24.7 | 13.6 | 3.2 | 3.9 | 19.6 | 11.4 | 2.8 | 5.1 |
| Respons Analyse | 26–31 Aug 2020 | 1,000 | – | 3.9 | 6.8 | 4.5 | 24.3 | 14.7 | 4.0 | 3.3 | 24.8 | 11.5 | 2.2 | 0.5 |
| Norstat | 24–31 Aug 2020 | 944 | – | 3.8 | 8.1 | 4.1 | 24.0 | 12.2 | 3.4 | 2.8 | 28.3 | 11.4 | 1.8 | 4.3 |
| Norstat | 17–23 Aug 2020 | 952 | – | 4.2 | 7.9 | 4.9 | 24.0 | 14.0 | 3.2 | 3.7 | 26.8 | 9.7 | 1.7 | 2.8 |
| Ipsos MMI | 17–19 Aug 2020 | 1,000 | 71.5 | 4.4 | 7.1 | 5.8 | 24.8 | 13.9 | 3.1 | 3.5 | 24.3 | 11.7 | 1.4 | 0.5 |
| Sentio | 11–16 Aug 2020 | 1,000 | – | 4.1 | 8.0 | 3.9 | 23.1 | 12.6 | 2.1 | 2.6 | 28.7 | 12.8 | 2.0 | 5.6 |
| Respons Analyse | 6–11 Aug 2020 | 1,001 | – | 3.8 | 7.6 | 5.2 | 25.5 | 14.4 | 3.6 | 3.9 | 23.0 | 10.4 | 2.6 | 2.5 |
| Norstat | 4–10 Aug 2020 | 950 | – | 3.8 | 6.8 | 4.7 | 24.2 | 13.8 | 2.8 | 4.1 | 24.7 | 13.0 | 2.2 | 0.5 |
| Kantar TNS | 4–7 Aug 2020 | 980 | 76.7 | 4.6 | 7.5 | 5.2 | 25.4 | 15.0 | 2.3 | 4.5 | 25.0 | 9.4 | 1.6 | 0.4 |
| Norfakta | 4–5 Aug 2020 | 1,001 | – | 4.1 | 7.2 | 6.1 | 26.6 | 13.2 | 2.5 | 3.6 | 23.5 | 12.5 | 0.7 | 3.1 |
| InFact | 4 Aug 2020 | 1,024 | – | 5.8 | 7.3 | 5.4 | 21.8 | 14.1 | 3.7 | 5.2 | 25.1 | 9.3 | 2.3 | 3.3 |
| Opinion Perduco | 29 Jul–3 Aug 2020 | 967 | 72.0 | 4.3 | 6.1 | 4.6 | 24.6 | 15.1 | 3.1 | 3.3 | 27.7 | 9.8 | 1.4 | 3.1 |
| Norfakta | 7–8 Jul 2020 | 1,000 | – | 4.2 | 6.9 | 4.9 | 27.3 | 13.7 | 3.5 | 3.8 | 23.9 | 10.5 | 1.2 | 3.4 |
| Kantar TNS | 24–30 Jun 2020 | 985 | 78.6 | 5.8 | 8.1 | 5.2 | 20.8 | 12.7 | 2.9 | 3.9 | 27.7 | 10.6 | 2.3 | 6.9 |
| Ipsos MMI | 22–24 Jun 2020 | 1,000 | – | 3.0 | 8.2 | 5.9 | 25.0 | 13.3 | 3.1 | 3.2 | 25.2 | 11.0 | 2.1 | 0.2 |
| Norstat | 15–21 Jun 2020 | 1,000 | – | 4.9 | 6.8 | 4.8 | 24.9 | 13.0 | 2.7 | 4.3 | 24.8 | 11.5 | 2.4 | 0.1 |
| Sentio | 9–13 Jun 2020 | 1,000 | – | 5.1 | 6.9 | 5.4 | 24.2 | 14.0 | 4.4 | 2.5 | 24.2 | 11.3 | 2.0 | Tie |
| Opinion Perduco | 2–8 Jun 2020 | 969 | 72.0 | 4.3 | 7.2 | 5.6 | 25.2 | 14.6 | 3.5 | 3.9 | 24.4 | 10.4 | 0.8 | 0.8 |
| Respons Analyse | 2–4 Jun 2020 | 1,002 | – | 4.7 | 6.8 | 5.3 | 23.5 | 14.5 | 3.1 | 3.7 | 24.2 | 12.4 | 1.8 | 0.7 |
| Norfakta | 2–3 Jun 2020 | 1,002 | – | 4.9 | 7.2 | 3.9 | 23.5 | 14.6 | 3.0 | 4.5 | 24.1 | 12.3 | 2.0 | 0.6 |
| Norstat | 26 May–1 Jun 2020 | 949 | 72.9 | 4.8 | 6.9 | 5.6 | 23.4 | 14.6 | 2.4 | 3.4 | 25.8 | 12.0 | 1.1 | 2.4 |
| Kantar TNS | 25–29 May 2020 | 982 | 78.6 | 4.7 | 7.3 | 4.8 | 23.5 | 13.8 | 1.6 | 3.5 | 27.3 | 11.9 | 1.7 | 3.8 |
| Ipsos MMI | 25–28 May 2020 | 905 | 77.6 | 3.8 | 7.6 | 6.2 | 25.5 | 13.0 | 3.6 | 2.6 | 25.4 | 10.0 | 2.3 | 0.1 |
| Norstat | 19–25 May 2020 | 957 | – | 4.6 | 5.5 | 5.0 | 25.8 | 15.0 | 2.0 | 3.2 | 26.2 | 12.1 | 0.6 | 0.4 |
| Sentio | 12–16 May 2020 | 1,000 | – | 3.3 | 7.1 | 4.4 | 25.5 | 13.5 | 3.3 | 4.0 | 26.0 | 11.0 | 2.0 | 0.5 |
| Opinion Perduco | 5–10 May 2020 | 970 | – | 3.7 | 6.6 | 5.6 | 26.7 | 12.0 | 2.7 | 3.6 | 28.3 | 9.6 | 1.3 | 1.6 |
| Norfakta | 5–6 May 2020 | 1,000 | 81.0 | 4.3 | 8.0 | 4.4 | 25.1 | 13.5 | 3.3 | 4.1 | 26.9 | 9.1 | 1.3 | 1.8 |
| Respons Analyse | 30 Apr–5 May 2020 | 1,000 | – | 3.5 | 6.2 | 5.0 | 27.0 | 14.7 | 3.0 | 3.6 | 26.5 | 9.4 | 1.1 | 0.5 |
| Norstat | 27 Apr–4 May 2020 | 957 | 74.4 | 3.3 | 6.6 | 5.2 | 24.7 | 15.3 | 3.1 | 3.2 | 26.5 | 10.1 | 1.8 | 1.8 |
| Kantar TNS | 27–29 Apr 2020 | 988 | 72.9 | 5.3 | 5.6 | 3.9 | 26.8 | 14.6 | 3.4 | 3.0 | 28.0 | 8.0 | 1.4 | 1.2 |
| Norstat | 20–26 Apr 2020 | 955 | – | 3.7 | 6.6 | 3.9 | 24.6 | 15.6 | 3.3 | 3.2 | 26.8 | 11.4 | 0.9 | 2.2 |
| Ipsos MMI | 20–22 Apr 2020 | 1,000 | 72.4 | 4.9 | 8.5 | 4.2 | 24.5 | 14.2 | 3.1 | 4.1 | 25.3 | 9.7 | 1.5 | 0.8 |
| Sentio | 14–20 Apr 2020 | 1,000 | – | 3.2 | 6.5 | 4.9 | 24.5 | 14.0 | 3.3 | 3.7 | 26.7 | 12.0 | 1.4 | 1.9 |
| Opinion Perduco | 31 Mar–5 Apr 2020 | 1,000 | – | 3.7 | 5.9 | 4.7 | 25.7 | 13.8 | 2.9 | 3.0 | 27.3 | 11.6 | 1.4 | 1.6 |
| Norfakta | 31 Mar–1 Apr 2020 | 1,000 | – | 2.5 | 9.1 | 5.0 | 23.3 | 14.7 | 3.3 | 4.1 | 25.9 | 11.1 | 1.0 | 2.6 |
| Respons Analyse | 26 Mar–1 Apr 2020 | 1,000 | – | 3.5 | 7.3 | 4.2 | 26.7 | 13.5 | 2.8 | 3.2 | 25.2 | 12.4 | 1.2 | 1.5 |
| Kantar TNS | 25–31 Mar 2020 | 980 | 74.1 | 3.8 | 7.0 | 4.6 | 24.8 | 14.8 | 2.3 | 4.1 | 24.6 | 12.3 | 1.6 | 0.2 |
| Norstat | 23–29 Mar 2020 | 953 | 75.7 | 3.7 | 7.2 | 3.7 | 25.7 | 15.3 | 3.6 | 2.8 | 24.9 | 12.0 | 1.1 | 0.8 |
| Norstat | 16–23 Mar 2020 | 952 | – | 4.1 | 7.6 | 3.8 | 26.7 | 14.6 | 2.2 | 3.2 | 23.3 | 12.7 | 2.1 | 3.4 |
| Ipsos MMI | 18–20 Mar 2020 | 1,000 | 64.9 | 4.7 | 9.0 | 4.4 | 24.9 | 17.4 | 2.6 | 3.7 | 20.8 | 11.4 | 1.1 | 4.1 |
| Sentio | 10–16 Mar 2020 | 1,000 | – | 2.7 | 7.1 | 7.3 | 24.3 | 17.5 | 3.4 | 3.4 | 18.8 | 13.0 | 2.6 | 5.5 |
| Opinion Perduco | 3–9 Mar 2020 | 970 | – | 3.9 | 6.9 | 6.7 | 24.0 | 18.3 | 3.5 | 3.1 | 18.8 | 13.5 | 1.2 | 5.2 |
| Norfakta | 3–4 Mar 2020 | 1,000 | 78.0 | 5.1 | 7.0 | 7.0 | 25.8 | 15.9 | 2.5 | 2.9 | 20.6 | 12.0 | 1.1 | 5.2 |
| Respons Analyse | 27 Feb–2 Mar 2020 | 1,000 | – | 5.4 | 7.2 | 5.1 | 24.9 | 16.7 | 3.3 | 3.5 | 17.9 | 14.6 | 1.4 | 7.0 |
| Norstat | 24 Feb–2 Mar 2020 | 949 | 72.7 | 4.6 | 8.4 | 4.9 | 23.7 | 16.4 | 2.7 | 4.1 | 19.9 | 13.2 | 2.1 | 3.8 |
| Kantar TNS | 24–28 Feb 2020 | 961 | 78.4 | 4.1 | 8.5 | 5.6 | 21.5 | 17.6 | 3.7 | 3.0 | 19.8 | 13.7 | 2.6 | 1.7 |
| Norstat | 17–23 Feb 2020 | – | – | 4.7 | 6.5 | 6.3 | 24.0 | 15.7 | 4.4 | 3.5 | 18.9 | 14.3 | 1.7 | 5.1 |
| Ipsos MMI | 17–19 Feb 2020 | 1,000 | 72.6 | 3.5 | 7.1 | 5.4 | 25.8 | 14.8 | 3.5 | 3.6 | 18.8 | 14.2 | 3.3 | 7.0 |
| Sentio | 11–17 Feb 2020 | – | – | 3.9 | 7.2 | 6.8 | 23.6 | 14.1 | 3.8 | 3.9 | 19.7 | 14.6 | 2.3 | 3.9 |
| Opinion Perduco | 4–10 Feb 2020 | 969 | – | 5.3 | 6.5 | 4.6 | 25.1 | 15.2 | 4.2 | 3.5 | 19.4 | 15.1 | 1.2 | 5.7 |
| Norfakta | 4–5 Feb 2020 | 1,000 | – | 4.2 | 7.6 | 5.2 | 22.2 | 15.9 | 4.4 | 4.5 | 19.4 | 14.9 | 1.5 | 2.8 |
| Respons Analyse | 30 Jan–3 Feb 2020 | 1,002 | – | 4.6 | 6.7 | 5.5 | 24.9 | 13.9 | 2.7 | 4.2 | 19.9 | 15.3 | 2.3 | 5.0 |
| Norstat | 27 Jan–2 Feb 2020 | 952 | – | 5.0 | 6.1 | 4.3 | 23.2 | 17.3 | 3.3 | 4.4 | 18.3 | 16.0 | 2.0 | 4.9 |
| Kantar TNS | 27–31 Jan 2020 | 990 | 80.3 | 4.3 | 7.7 | 5.9 | 24.2 | 15.0 | 4.0 | 4.3 | 17.8 | 15.7 | 1.1 | 6.4 |
| Sentio | 24–27 Jan 2020 | 1,007 | – | 6.9 | 7.7 | 4.9 | 25.6 | 12.5 | 2.0 | 3.9 | 16.2 | 17.5 | 2.6 | 8.1 |
| Norstat | 21–27 Jan 2020 | – | – | 3.7 | 7.6 | 4.9 | 26.8 | 12.8 | 3.0 | 4.0 | 21.0 | 14.7 | 1.5 | 5.8 |
| Ipsos MMI | 20–22 Jan 2020 | 1,000 | 75.2 | 4.1 | 5.9 | 3.5 | 25.9 | 16.4 | 3.7 | 2.8 | 19.7 | 15.7 | 2.3 | 6.2 |
| Kantar TNS | 21 Jan 2020 | 800 | 80.0 | 5.1 | 6.5 | 3.5 | 25.3 | 14.5 | 2.2 | 5.2 | 20.4 | 14.6 | 2.6 | 4.9 |
| Respons Analyse | 20–21 Jan 2020 | 1,182 | – | 3.8 | 7.0 | 5.2 | 25.2 | 14.8 | 3.1 | 3.2 | 20.9 | 14.2 | 2.6 | 4.3 |
| Sentio | 14–18 Jan 2020 | 1,000 | – | 4.5 | 7.9 | 5.4 | 25.4 | 16.8 | 4.1 | 3.0 | 20.6 | 10.8 | 1.4 | 4.8 |
| Opinion Perduco | 15 Jan 2020 | 962 | – | 4.4 | 7.4 | 4.3 | 25.5 | 20.9 | 2.7 | 2.5 | 18.7 | 11.8 | 2.0 | 4.6 |
| Kantar TNS | 6–10 Jan 2020 | 986 | 80.8 | 4.7 | 8.8 | 6.5 | 23.5 | 17.9 | 2.2 | 3.2 | 22.4 | 8.7 | 2.2 | 1.1 |
| Norfakta | 7–8 Jan 2020 | 1,000 | 78.0 | 4.8 | 6.2 | 5.3 | 26.7 | 16.6 | 2.4 | 3.2 | 21.3 | 10.9 | 2.6 | 5.4 |
| Respons Analyse | 2–6 Jan 2020 | 1,001 | – | 5.1 | 6.6 | 6.1 | 24.0 | 15.8 | 2.5 | 4.2 | 22.4 | 11.4 | 1.9 | 1.6 |
| 2017 election | 11 Sep 2017 | — | 78.3 | 2.4 | 6.0 | 3.2 | 27.4 | 10.3 | 4.4 | 4.2 | 25.0 | 15.2 | 1.7 | 2.4 |
2019
| Polling firm | Fieldwork date | Sample size | Resp. | R | SV | MDG | Ap | Sp | V | KrF | H | FrP | Others | Lead |
|---|---|---|---|---|---|---|---|---|---|---|---|---|---|---|
| Norstat | 30 Dec 2019–5 Jan 2020 | 960 | – | 3.6 | 7.2 | 6.0 | 26.1 | 15.7 | 2.3 | 3.6 | 22.4 | 10.3 | 2.8 | 3.7 |
| Ipsos MMI | 16–18 Dec 2019 | – | – | 5.9 | 8.5 | 5.0 | 23.4 | 15.8 | 2.8 | 3.0 | 22.1 | 11.3 | 2.2 | 1.3 |
| Norstat | 9–15 Dec 2019 | 1,000 | – | 4.6 | 7.1 | 4.6 | 25.5 | 18.5 | 2.9 | 2.6 | 20.9 | 11.8 | 1.6 | 4.6 |
| Opinion Perduco | 3–8 Dec 2019 | 966 | – | 5.7 | 7.5 | 5.9 | 22.9 | 20.2 | 1.9 | 2.6 | 20.6 | 10.7 | 2.0 | 2.3 |
| Norfakta | 3–4 Dec 2019 | 1,000 | 81.0 | 3.9 | 7.7 | 5.0 | 21.3 | 19.2 | 3.9 | 4.0 | 22.6 | 10.1 | 2.3 | 1.3 |
| Respons Analyse | 28 Nov–2 Dec 2019 | 1,000 | – | 5.3 | 6.2 | 5.9 | 23.0 | 17.4 | 3.5 | 3.9 | 22.0 | 10.3 | 2.5 | 1.0 |
| Sentio | 26 Nov–2 Dec 2019 | 1,000 | – | 5.6 | 8.3 | 6.9 | 24.2 | 15.6 | 2.4 | 3.5 | 20.8 | 11.1 | 1.8 | 3.4 |
| Kantar TNS | 25–29 Nov 2019 | 974 | 81.5 | 5.0 | 7.9 | 6.1 | 21.9 | 17.6 | 4.4 | 4.1 | 19.1 | 9.8 | 4.2 | 2.8 |
| Norstat | 19–25 Nov 2019 | 966 | 77.5 | 4.5 | 6.5 | 6.4 | 22.9 | 18.1 | 3.5 | 2.8 | 19.7 | 12.5 | 3.2 | 3.2 |
| Ipsos MMI | 18–20 Nov 2019 | – | – | 5.0 | 8.3 | 5.3 | 22.0 | 19.2 | 2.6 | 3.5 | 20.9 | 9.7 | 3.5 | 1.1 |
| Norstat | 12–18 Nov 2019 | – | – | 4.2 | 8.1 | 6.9 | 22.9 | 20.0 | 2.0 | 2.9 | 20.8 | 9.0 | 3.1 | 2.1 |
| Opinion Perduco | 5–11 Nov 2019 | 964 | – | 4.4 | 8.4 | 6.5 | 21.7 | 20.9 | 3.0 | 3.8 | 20.6 | 8.9 | 1.8 | 0.8 |
| Norfakta | 5–6 Nov 2019 | 1,000 | 79.0 | 4.2 | 7.1 | 6.1 | 22.3 | 19.2 | 4.3 | 3.4 | 22.9 | 8.4 | 2.1 | 0.6 |
| Respons Analyse | 31 Oct–4 Nov 2019 | 1,003 | – | 6.0 | 6.5 | 5.9 | 23.0 | 16.5 | 3.2 | 3.9 | 21.3 | 11.4 | 2.3 | 1.7 |
| Sentio | 29 Oct–2 Nov 2019 | 1,000 | – | 3.9 | 7.7 | 6.3 | 22.6 | 20.0 | 3.9 | 3.1 | 20.8 | 9.2 | 2.6 | 1.8 |
| Kantar TNS | 28 Oct–1 Nov 2019 | 982 | 81.9 | 6.6 | 5.6 | 6.9 | 22.6 | 19.5 | 3.4 | 2.9 | 21.1 | 9.2 | 2.2 | 1.5 |
| Norstat | 22–28 Oct 2019 | 957 | 73.5 | 6.0 | 7.4 | 6.1 | 23.7 | 17.5 | 3.3 | 3.9 | 21.8 | 8.4 | 2.0 | 1.9 |
| Ipsos MMI | 21–23 Oct 2019 | 764 | – | 6.1 | 6.4 | 7.0 | 22.6 | 17.6 | 3.6 | 2.7 | 21.1 | 10.3 | 2.5 | 1.5 |
| Norstat | 15–21 Oct 2019 | 929 | – | 4.9 | 7.7 | 6.2 | 21.6 | 18.1 | 3.3 | 3.6 | 20.1 | 11.7 | 2.8 | 1.5 |
| Sentio | 8–14 Oct 2019 | 1,000 | – | 3.2 | 6.4 | 7.7 | 24.9 | 17.6 | 4.1 | 3.6 | 20.9 | 9.0 | 2.7 | 4.0 |
| Opinion Perduco | 1–7 Oct 2019 | 951 | – | 4.6 | 8.2 | 5.5 | 22.2 | 18.7 | 3.7 | 3.4 | 22.8 | 9.0 | 1.9 | 0.6 |
| Norfakta | 1–2 Oct 2019 | 1,000 | 81.0 | 4.0 | 7.0 | 6.0 | 23.5 | 17.2 | 3.8 | 3.3 | 21.4 | 10.5 | 3.3 | 2.1 |
| Kantar TNS | 30 Sep–4 Oct 2019 | 980 | 84.6 | 6.1 | 8.9 | 7.2 | 23.3 | 15.6 | 2.6 | 3.9 | 20.2 | 9.0 | 3.2 | 3.1 |
| Norstat | 24–30 Sep 2019 | – | – | 3.6 | 6.6 | 7.8 | 24.1 | 18.6 | 3.4 | 3.7 | 19.7 | 8.6 | 4.0 | 4.4 |
| Respons Analyse | 23–25 Sep 2019 | 1,000 | – | 3.3 | 6.7 | 6.9 | 26.3 | 14.8 | 3.0 | 4.2 | 20.6 | 11.9 | 2.3 | 5.7 |
| Ipsos MMI | 23–25 Sep 2019 | 939 | – | 4.1 | 8.4 | 6.4 | 22.0 | 17.3 | 2.6 | 3.4 | 21.3 | 11.7 | 2.8 | 0.7 |
| Norstat | 17–19 Sep 2019 | 712 | – | 4.4 | 9.1 | 8.6 | 20.8 | 15.8 | 2.9 | 3.7 | 21.1 | 11.2 | 2.4 | 0.3 |
| Sentio | 10–16 Sep 2019 | 1,000 | – | 4.0 | 6.9 | 6.1 | 22.6 | 16.8 | 3.0 | 3.4 | 21.1 | 12.4 | 3.6 | 1.5 |
| 2019 local elections | 9 Sep 2019 | – | – | 3.8 | 6.1 | 6.8 | 24.8 | 14.4 | 3.9 | 4.0 | 20.1 | 8.2 | 7.9 | 4.7 |
| Norfakta | 3–4 Sep 2019 | 1,003 | – | 3.3 | 7.4 | 6.5 | 23.8 | 17.1 | 2.4 | 3.3 | 22.1 | 11.0 | 3.1 | 1.7 |
| Norstat | 27 Aug–2 Sep 2019 | 751 | 79.0 | 4.5 | 6.1 | 5.4 | 24.8 | 16.1 | 3.4 | 3.9 | 21.2 | 11.6 | 4.1 | 3.6 |
| Norstat | 20–26 Aug 2019 | 943 | – | 5.0 | 6.3 | 5.7 | 22.2 | 16.0 | 3.1 | 4.4 | 22.8 | 11.7 | 2.8 | 0.6 |
| Ipsos MMI | 19–21 Aug 2019 | 719 | – | 4.4 | 7.9 | 6.7 | 23.4 | 16.1 | 3.0 | 2.7 | 20.9 | 11.1 | 3.8 | 2.5 |
| Sentio | 13–18 Aug 2019 | 1,000 | – | 4.8 | 6.5 | 5.4 | 27.3 | 14.4 | 3.7 | 3.5 | 20.9 | 8.9 | 4.5 | 6.4 |
| Respons Analyse | 9–14 Aug 2019 | 1,000 | 75.0 | 4.7 | 6.3 | 7.0 | 24.0 | 15.4 | 2.5 | 4.5 | 21.9 | 10.6 | 3.1 | 2.1 |
| Norstat | 6–12 Aug 2019 | 953 | 76.4 | 6.4 | 5.9 | 5.3 | 24.6 | 14.2 | 2.7 | 3.2 | 22.8 | 10.9 | 4.1 | 1.8 |
| Kantar TNS | 5–9 Aug 2019 | 973 | 76.5 | 5.2 | 8.4 | 6.4 | 23.5 | 15.3 | 2.0 | 3.8 | 22.8 | 9.1 | 3.5 | 0.7 |
| Norfakta | 6–7 Aug 2019 | 1,000 | 82.0 | 5.0 | 7.5 | 3.7 | 24.4 | 15.9 | 2.8 | 3.9 | 24.2 | 9.0 | 3.7 | 0.2 |
| Opinion Perduco | 30 Jul–5 Aug 2019 | 960 | 69.0 | 5.2 | 8.8 | 7.0 | 22.2 | 14.6 | 3.1 | 3.2 | 22.1 | 10.1 | 3.8 | 0.1 |
| Norfakta | 2–3 Jul 2019 | 1,001 | 75.0 | 4.2 | 7.6 | 5.5 | 24.4 | 15.1 | 2.9 | 4.3 | 21.2 | 8.8 | 6.0 | 3.2 |
| Kantar TNS | 24–28 Jun 2019 | 978 | 79.8 | 5.7 | 7.8 | 4.9 | 25.5 | 13.3 | 5.0 | 3.4 | 22.0 | 7.5 | 4.9 | 3.5 |
| Ipsos MMI | 24–26 Jun 2019 | 723 | – | 5.1 | 6.9 | 3.9 | 27.8 | 14.4 | 2.3 | 2.3 | 20.5 | 10.7 | 6.0 | 7.3 |
| Norstat | 18–24 Jun 2019 | 950 | – | 5.4 | 7.0 | 5.7 | 26.0 | 14.3 | 2.5 | 4.2 | 23.0 | 9.0 | 2.9 | 3.0 |
| Sentio | 11–17 Jun 2019 | 1,000 | – | 4.5 | 6.8 | 5.8 | 25.2 | 15.2 | 2.5 | 2.7 | 22.7 | 10.5 | 4.1 | 2.5 |
| Opinion Perduco | 4–10 Jun 2019 | 956 | 74.0 | 7.1 | 6.4 | 6.5 | 23.0 | 16.9 | 2.8 | 2.6 | 19.1 | 11.4 | 4.2 | 3.9 |
| Respons Analyse | 3–6 Jun 2019 | 1,002 | 78.0 | 5.2 | 6.8 | 4.9 | 26.0 | 13.3 | 3.5 | 3.6 | 23.1 | 10.7 | 2.9 | 2.9 |
| Norfakta | 4–5 Jun 2019 | 1,000 | – | 5.9 | 6.0 | 5.7 | 25.2 | 15.8 | 1.5 | 3.2 | 24.3 | 10.2 | 2.4 | 0.9 |
| Norstat | 28 May–3 Jun 2019 | 951 | – | 5.0 | 6.8 | 6.3 | 24.4 | 14.9 | 2.7 | 3.5 | 21.0 | 11.4 | 4.0 | 3.4 |
| Ipsos MMI | 27–29 May 2019 | 739 | – | 5.1 | 6.3 | 4.6 | 26.9 | 15.2 | 2.0 | 2.3 | 20.7 | 12.1 | 4.8 | 6.2 |
| Norstat | 21–27 May 2019 | 940 | – | 4.8 | 6.5 | 4.3 | 23.7 | 13.3 | 3.4 | 3.7 | 22.9 | 12.5 | 5.0 | 0.8 |
| Sentio | 14–18 May 2019 | 1,000 | – | 6.6 | 6.1 | 5.1 | 23.1 | 15.8 | 2.3 | 3.6 | 22.6 | 11.9 | 2.9 | 0.5 |
| Opinion Perduco | 7–13 May 2019 | 951 | – | 5.1 | 8.3 | 4.0 | 27.2 | 14.1 | 2.1 | 2.7 | 21.2 | 13.1 | 2.4 | 6.0 |
| Norfakta | 7–8 May 2019 | 1,003 | – | 4.9 | 7.4 | 3.0 | 25.1 | 14.4 | 3.0 | 3.2 | 24.4 | 11.9 | 2.7 | 0.7 |
| Norstat | 30 Apr–6 May 2019 | 1,000 | – | 5.0 | 6.2 | 3.9 | 26.5 | 15.0 | 3.7 | 3.5 | 20.2 | 12.6 | 3.3 | 6.3 |
| Kantar TNS | 29 Apr–3 May 2019 | 987 | 79.3 | 5.4 | 7.2 | 3.9 | 26.0 | 14.7 | 4.1 | 3.9 | 21.0 | 11.6 | 2.3 | 5.0 |
| Norstat | 2 May 2019 | – | – | 5.1 | 7.5 | 4.8 | 27.6 | 15.7 | 2.3 | 3.3 | 20.4 | 11.2 | 2.3 | 7.2 |
| Respons Analyse | 29 Apr–2 May 2019 | 1,000 | – | 3.9 | 8.4 | 4.4 | 28.2 | 12.5 | 1.9 | 4.1 | 21.6 | 13.0 | 2.0 | 6.6 |
| Ipsos MMI | 23–25 Apr 2019 | 942 | – | 4.5 | 6.8 | 3.0 | 28.1 | 14.4 | 2.2 | 3.9 | 23.8 | 10.1 | 3.2 | 4.3 |
| Sentio | 16 Apr 2019 | – | – | 4.6 | 7.0 | 4.1 | 27.5 | 15.4 | 2.4 | 3.4 | 23.2 | 10.0 | 2.4 | 4.3 |
| Opinion Perduco | 2–8 Apr 2019 | 954 | – | 4.5 | 8.2 | 3.7 | 27.5 | 16.7 | 2.3 | 2.6 | 21.5 | 10.6 | 2.5 | 6.0 |
| Respons Analyse | 2–4 Apr 2019 | 1,001 | – | 4.7 | 7.6 | 3.9 | 25.6 | 15.6 | 4.3 | 3.0 | 22.4 | 10.1 | 2.8 | 3.2 |
| Norfakta | 2–3 Apr 2019 | 1,032 | – | 4.3 | 8.4 | 3.0 | 26.1 | 15.2 | 3.0 | 3.8 | 22.5 | 11.2 | 2.5 | 3.6 |
| Norstat | 26 Mar–1 Apr 2019 | 628 | – | 3.7 | 7.0 | 4.7 | 24.0 | 16.9 | 2.9 | 4.2 | 22.3 | 11.9 | 2.4 | 1.7 |
| Kantar TNS | 25–29 Mar 2019 | 982 | 80.6 | 5.1 | 7.5 | 5.0 | 24.3 | 16.9 | 3.4 | 3.7 | 21.6 | 10.4 | 2.2 | 2.7 |
| Norstat | 27 Mar 2019 | – | – | 4.9 | 6.8 | 4.3 | 26.6 | 14.3 | 1.8 | 2.4 | 24.6 | 12.1 | 2.2 | 2.0 |
| Ipsos MMI | 18–20 Mar 2019 | 942 | – | 5.6 | 7.0 | 3.6 | 28.8 | 14.4 | 2.0 | 2.5 | 21.3 | 11.7 | 3.1 | 7.5 |
| Sentio | 12–18 Mar 2019 | 1,000 | – | 5.4 | 7.3 | 3.2 | 27.7 | 14.5 | 2.3 | 3.0 | 24.7 | 10.6 | 1.4 | 3.0 |
| Opinion Perduco | 5–11 Mar 2019 | 957 | – | 4.9 | 7.1 | 6.0 | 25.1 | 12.7 | 2.0 | 4.8 | 26.1 | 10.6 | 0.8 | 1.0 |
| Norfakta | 5–6 Mar 2019 | 1,002 | 74.0 | 4.5 | 8.1 | 3.7 | 27.0 | 14.0 | 2.3 | 3.3 | 24.6 | 10.7 | 1.8 | 2.4 |
| Respons Analyse | 28 Feb–4 Mar 2019 | 1,000 | – | 5.0 | 7.6 | 3.3 | 24.3 | 14.6 | 2.8 | 3.8 | 24.3 | 12.6 | 1.7 | Tie |
| Norstat | 26 Feb–4 Mar 2019 | 653 | – | 4.8 | 8.0 | 4.4 | 26.5 | 12.4 | 1.9 | 4.0 | 24.3 | 12.1 | 1.5 | 2.2 |
| Kantar TNS | 25 Feb–1 Mar 2019 | 972 | 73.7 | 4.8 | 8.0 | 3.6 | 27.4 | 12.8 | 2.2 | 3.7 | 24.8 | 10.2 | 2.7 | 2.6 |
| Norstat | 19–25 Feb 2019 | – | – | 6.2 | 6.6 | 3.0 | 26.9 | 16.0 | 1.8 | 3.2 | 22.3 | 12.5 | 1.5 | 4.6 |
| Ipsos MMI | 18–20 Feb 2019 | 932 | – | 6.6 | 7.0 | 3.8 | 26.9 | 13.0 | 2.3 | 2.5 | 25.1 | 10.0 | 2.8 | 1.8 |
| Sentio | 12–19 Feb 2019 | 1,000 | – | 5.1 | 8.0 | 3.9 | 27.4 | 15.6 | 2.3 | 3.4 | 21.1 | 10.8 | 2.4 | 6.3 |
| Opinion Perduco | 5–11 Feb 2019 | 942 | 73.0 | 7.6 | 8.0 | 2.3 | 28.2 | 13.9 | 2.3 | 3.2 | 22.1 | 11.8 | 0.6 | 6.1 |
| Norfakta | 5–6 Feb 2019 | 1,005 | 78.0 | 4.0 | 7.2 | 3.3 | 29.3 | 12.7 | 3.3 | 4.1 | 22.9 | 10.9 | 2.3 | 6.4 |
| Respons Analyse | 31 Jan–4 Feb 2019 | 1,001 | 72.0 | 3.6 | 7.8 | 3.8 | 29.7 | 12.2 | 3.9 | 3.8 | 22.9 | 10.5 | 1.8 | 6.8 |
| Norstat | 29 Jan–4 Feb 2019 | 937 | 70.0 | 4.8 | 7.8 | 3.2 | 29.2 | 11.8 | 2.6 | 3.4 | 22.9 | 12.0 | 2.2 | 6.3 |
| Kantar TNS | 28 Jan–2 Feb 2019 | 986 | 82.7 | 6.2 | 8.8 | 3.6 | 26.5 | 10.4 | 2.5 | 4.1 | 23.6 | 11.7 | 2.5 | 2.9 |
| Norstat | 22–28 Jan 2019 | 691 | – | 4.4 | 7.3 | 3.7 | 29.1 | 11.2 | 2.7 | 3.5 | 22.5 | 13.5 | 2.1 | 6.6 |
| Ipsos MMI | 21–23 Jan 2019 | 935 | – | 4.2 | 8.0 | 3.2 | 29.8 | 10.9 | 2.2 | 2.7 | 22.8 | 13.0 | 3.2 | 7.0 |
| Sentio | 15–21 Jan 2019 | 1,000 | 65.2 | 3.1 | 6.9 | 3.8 | 26.3 | 13.4 | 4.3 | 3.5 | 23.6 | 13.2 | 1.8 | 2.7 |
| Opinion Perduco | 8–14 Jan 2019 | 957 | 72.0 | 5.5 | 7.9 | 3.2 | 28.5 | 12.6 | 2.4 | 3.7 | 22.9 | 10.8 | 2.5 | 5.6 |
| Kantar TNS | 3–10 Jan 2019 | 980 | 77.4 | 4.6 | 7.2 | 2.8 | 27.9 | 12.2 | 3.6 | 3.0 | 24.2 | 12.0 | 2.0 | 3.7 |
| Norfakta | 8–9 Jan 2019 | 1,000 | – | 3.9 | 7.4 | 2.8 | 27.7 | 12.5 | 3.3 | 3.8 | 24.7 | 12.0 | 1.9 | 3.0 |
| Respons Analyse | 3–7 Jan 2019 | 1,001 | – | 3.1 | 6.7 | 2.8 | 29.7 | 10.5 | 4.4 | 3.8 | 26.0 | 11.5 | 1.5 | 3.7 |
| Norstat | 2–7 Jan 2019 | 925 | 76.5 | 3.3 | 7.4 | 2.4 | 27.3 | 12.1 | 3.1 | 3.7 | 27.0 | 12.2 | 1.6 | 0.3 |
| 2017 election | 11 Sep 2017 | — | 78.3 | 2.4 | 6.0 | 3.2 | 27.4 | 10.3 | 4.4 | 4.2 | 25.0 | 15.2 | 1.7 | 2.4 |
2018
| Polling firm | Fieldwork date | Sample size | Resp. | R | SV | MDG | Ap | Sp | V | KrF | H | FrP | Others | Lead |
|---|---|---|---|---|---|---|---|---|---|---|---|---|---|---|
| Ipsos MMI | 17–19 Dec 2018 | 944 | – | 2.7 | 8.1 | 3.7 | 28.5 | 10.4 | 3.0 | 3.8 | 24.7 | 12.8 | 2.3 | 3.8 |
| Norstat | 11–17 Dec 2018 | 927 | – | 4.1 | 6.9 | 3.4 | 26.8 | 11.2 | 3.4 | 3.5 | 26.5 | 12.4 | 1.8 | 0.3 |
| Opinion Perduco | 4–10 Dec 2018 | 946 | 73.0 | 5.1 | 5.8 | 3.6 | 27.1 | 11.9 | 4.4 | 3.4 | 22.9 | 14.6 | 1.1 | 4.2 |
| Norfakta | 4–5 Dec 2018 | 1,000 | 76.0 | 3.1 | 7.4 | 2.5 | 28.4 | 11.6 | 3.0 | 3.8 | 25.9 | 12.0 | 2.3 | 2.5 |
| Respons Analyse | 29 Nov–4 Dec 2018 | 1,000 | – | 3.9 | 8.8 | 2.4 | 26.0 | 10.5 | 3.4 | 4.1 | 25.7 | 13.5 | 1.7 | 0.3 |
| Sentio | 28 Nov–4 Dec 2018 | 1,000 | 70.8 | 4.8 | 5.5 | 2.4 | 30.0 | 12.2 | 4.3 | 3.5 | 24.3 | 12.0 | 1.1 | 5.7 |
| Kantar TNS | 3 Dec 2018 | 968 | 74.6 | 4.8 | 6.3 | 2.8 | 27.4 | 11.9 | 3.6 | 3.0 | 24.7 | 13.9 | 0.8 | 2.7 |
| Norstat | 20–25 Nov 2018 | 933 | – | 3.3 | 7.0 | 2.8 | 29.7 | 11.4 | 2.8 | 3.2 | 24.7 | 13.1 | 2.0 | 5.0 |
| Ipsos MMI | 19–21 Nov 2018 | 917 | – | 3.6 | 6.1 | 2.5 | 31.2 | 11.7 | 3.6 | 3.3 | 23.1 | 12.8 | 2.1 | 8.1 |
| Norstat | 13–19 Nov 2018 | 937 | – | 3.3 | 6.6 | 2.9 | 29.0 | 12.0 | 3.2 | 4.3 | 24.6 | 13.2 | 1.7 | 4.4 |
| Opinion Perduco | 6–12 Nov 2018 | 950 | 74.0 | 4.9 | 6.0 | 3.3 | 28.3 | 11.9 | 3.7 | 3.8 | 26.2 | 10.8 | 1.1 | 2.1 |
| Respons Analyse | 5–7 Nov 2018 | 1,000 | – | 3.9 | 6.0 | 2.9 | 28.4 | 10.3 | 4.1 | 4.2 | 26.5 | 12.8 | 0.9 | 1.9 |
| Norfakta | 5 Nov 2018 | 1,005 | 80.0 | 3.9 | 5.0 | 2.2 | 29.1 | 11.7 | 3.8 | 4.0 | 26.1 | 13.2 | 0.9 | 3.0 |
| Sentio | 30 Oct–5 Nov 2018 | 1,000 | 68.9 | 4.4 | 7.5 | 2.4 | 25.0 | 10.0 | 4.5 | 4.7 | 26.9 | 13.7 | 1.0 | 1.9 |
| Kantar TNS | 24–30 Oct 2018 | 990 | 79.2 | 4.8 | 7.2 | 2.8 | 27.6 | 9.0 | 2.3 | 3.0 | 26.8 | 13.8 | 2.6 | 0.8 |
| Norstat | 23–28 Oct 2018 | 693 | – | 3.5 | 6.7 | 3.2 | 27.2 | 12.1 | 3.7 | 3.9 | 24.3 | 14.1 | 1.3 | 2.9 |
| Ipsos MMI | 22–24 Oct 2018 | 947 | – | 4.0 | 7.7 | 2.2 | 26.0 | 12.4 | 5.1 | 4.4 | 26.3 | 10.4 | 1.5 | 0.3 |
| Norstat | 16–22 Oct 2018 | 941 | – | 3.9 | 7.2 | 2.0 | 28.7 | 10.3 | 3.7 | 3.6 | 25.4 | 13.6 | 1.7 | 3.3 |
| Sentio | 9–18 Oct 2018 | 1,000 | 70.3 | 3.6 | 6.6 | 2.4 | 28.8 | 10.5 | 2.8 | 4.5 | 25.7 | 12.7 | 2.5 | 3.1 |
| InFact | 9–10 Oct 2018 | 1,009 | – | 4.1 | 5.7 | 2.7 | 24.4 | 11.2 | 3.8 | 4.8 | 26.1 | 14.7 | 2.5 | 1.7 |
| Opinion Perduco | 4–10 Oct 2018 | 944 | 72.0 | 5.1 | 5.9 | 3.2 | 26.6 | 12.7 | 2.6 | 5.0 | 25.0 | 13.0 | 0.9 | 1.6 |
| Norfakta | 2–3 Oct 2018 | 1,001 | – | 4.0 | 6.6 | 2.2 | 28.2 | 11.2 | 2.4 | 4.1 | 26.0 | 13.3 | 2.1 | 2.2 |
| Respons Analyse | 1–3 Oct 2018 | 1,000 | – | 3.0 | 6.7 | 2.7 | 27.7 | 9.8 | 3.9 | 4.7 | 25.5 | 14.4 | 1.6 | 2.2 |
| Norstat | 24–29 Sep 2018 | 924 | – | 3.3 | 7.1 | 4.2 | 26.9 | 11.2 | 3.5 | 3.7 | 24.7 | 14.0 | 1.4 | 2.2 |
| Kantar TNS | 24–28 Sep 2018 | 973 | 80.9 | 4.0 | 7.6 | 2.4 | 26.7 | 10.4 | 4.1 | 3.8 | 26.7 | 12.7 | 1.4 | Tie |
| Ipsos MMI | 24–26 Sep 2018 | 932 | – | 4.6 | 6.1 | 2.3 | 28.7 | 10.1 | 2.3 | 3.0 | 25.7 | 14.9 | 2.3 | 3.0 |
| Norstat | 18–24 Sep 2018 | 932 | – | 5.0 | 6.2 | 2.3 | 26.6 | 12.0 | 3.4 | 3.0 | 24.3 | 15.7 | 1.4 | 2.3 |
| Sentio | 11–17 Sep 2018 | 1,000 | 70.7 | 4.8 | 6.3 | 3.8 | 28.0 | 9.1 | 3.0 | 3.9 | 27.4 | 11.8 | 1.8 | 0.6 |
| Respons Analyse | 6–10 Sep 2018 | 1,002 | – | 4.7 | 6.3 | 3.5 | 25.5 | 10.4 | 3.8 | 3.9 | 26.0 | 14.1 | 1.8 | 0.5 |
| Opinion Perduco | 4–10 Sep 2018 | 944 | 72.0 | 3.5 | 7.1 | 3.0 | 27.7 | 10.6 | 3.4 | 2.9 | 26.4 | 13.1 | 2.3 | 1.3 |
| Kantar TNS | 6 Sep 2018 | 979 | 73.5 | 5.5 | 6.5 | 2.4 | 24.9 | 11.6 | 3.5 | 3.7 | 29.0 | 10.4 | 2.6 | 4.1 |
| Norfakta | 4–5 Sep 2018 | 1,000 | 78.0 | 4.6 | 7.0 | 2.1 | 24.6 | 11.1 | 4.2 | 4.0 | 24.1 | 17.6 | 0.7 | 0.5 |
| Norstat | 28 Aug–2 Sep 2018 | 721 | – | 4.4 | 6.0 | 2.8 | 26.2 | 11.2 | 3.3 | 3.5 | 26.6 | 13.9 | 2.3 | 0.4 |
| Norstat | 20–26 Aug 2018 | 928 | – | 4.2 | 6.9 | 3.6 | 24.4 | 12.5 | 3.0 | 3.6 | 27.4 | 12.9 | 1.4 | 3.0 |
| Ipsos MMI | 20–25 Aug 2018 | 943 | – | 3.7 | 6.0 | 3.2 | 28.5 | 11.5 | 3.9 | 3.3 | 24.8 | 13.0 | 2.1 | 3.7 |
| Respons Analyse | 16–20 Aug 2018 | 1,001 | – | 4.1 | 7.7 | 2.2 | 25.9 | 10.3 | 5.2 | 3.9 | 25.6 | 14.6 | 0.5 | 0.3 |
| Sentio | 14–20 Aug 2018 | 1,000 | 67.8 | 4.4 | 6.4 | 3.4 | 25.9 | 10.7 | 3.6 | 4.2 | 26.6 | 13.3 | 1.4 | 0.7 |
| Norstat | 7–12 Aug 2018 | 932 | 70.9 | 5.3 | 6.1 | 3.4 | 23.8 | 11.8 | 3.5 | 4.0 | 27.5 | 12.7 | 1.8 | 3.7 |
| Norfakta | 7–8 Aug 2018 | 1,003 | – | 3.7 | 5.8 | 2.4 | 27.8 | 12.3 | 5.1 | 4.8 | 24.6 | 12.9 | 0.7 | 3.2 |
| Kantar TNS | 1–7 Aug 2018 | 982 | 75.4 | 5.3 | 8.0 | 2.5 | 24.4 | 13.6 | 3.6 | 5.3 | 26.1 | 10.1 | 1.1 | 1.7 |
| Opinion Perduco | 31 Jul–6 Aug 2018 | 953 | 72.0 | 5.8 | 6.6 | 4.1 | 28.2 | 11.2 | 2.4 | 4.2 | 23.6 | 12.6 | 1.2 | 4.6 |
| Norfakta | 3–4 Jul 2018 | 1,001 | 76.0 | 3.9 | 7.5 | 3.7 | 23.7 | 9.7 | 3.4 | 5.0 | 26.3 | 14.8 | 2.0 | 2.6 |
| Ipsos MMI | 25–27 Jun 2018 | 941 | – | 3.8 | 7.1 | 2.4 | 22.2 | 11.4 | 3.9 | 4.7 | 27.9 | 13.5 | 3.1 | 5.7 |
| Norstat | 19–25 Jun 2018 | 941 | – | 4.9 | 7.5 | 2.5 | 21.5 | 10.7 | 5.1 | 4.2 | 27.8 | 13.6 | 2.2 | 6.3 |
| Sentio | 12–16 Jun 2018 | 1,000 | 70.4 | 5.3 | 7.3 | 2.1 | 25.2 | 10.2 | 3.2 | 4.1 | 27.1 | 14.0 | 1.8 | 1.9 |
| Opinion Perduco | 5–11 Jun 2018 | 954 | 73.0 | 4.8 | 6.5 | 4.2 | 24.0 | 10.7 | 4.1 | 3.8 | 27.1 | 13.0 | 1.8 | 3.1 |
| Norfakta | 5–6 Jun 2018 | 1,002 | 79.0 | 4.4 | 6.0 | 3.4 | 24.1 | 11.3 | 4.5 | 3.0 | 29.4 | 12.5 | 1.4 | 5.3 |
| Respons Analyse | 31 May–4 Jun 2018 | 1,000 | – | 4.8 | 7.6 | 2.9 | 22.0 | 11.0 | 3.7 | 4.1 | 26.4 | 15.1 | 2.4 | 4.4 |
| Norstat | 27 May–4 Jun 2018 | 930 | – | 4.5 | 7.5 | 3.4 | 23.4 | 11.0 | 4.1 | 3.8 | 27.6 | 13.1 | 1.7 | 4.2 |
| Kantar TNS | 28 May–1 Jun 2018 | 977 | 76.2 | 5.6 | 8.5 | 3.2 | 23.4 | 11.3 | 4.5 | 5.3 | 24.5 | 12.4 | 1.3 | 1.1 |
| Ipsos MMI | 28–30 May 2018 | 939 | – | 3.2 | 7.7 | 3.0 | 22.9 | 11.1 | 5.9 | 3.8 | 27.0 | 13.5 | 1.9 | 4.1 |
| Norstat | 22–28 May 2018 | 929 | – | 4.0 | 7.2 | 2.7 | 23.6 | 11.8 | 4.1 | 4.2 | 26.4 | 13.9 | 2.3 | 2.8 |
| Sentio | 14–22 May 2018 | 1,000 | 72.3 | 3.4 | 8.0 | 2.9 | 23.5 | 10.6 | 3.2 | 3.8 | 28.4 | 14.0 | 2.3 | 4.9 |
| Opinion Perduco | 8–14 May 2018 | 945 | 73.0 | 4.4 | 7.1 | 3.3 | 22.8 | 10.5 | 3.8 | 5.5 | 26.5 | 15.0 | 1.2 | 3.7 |
| Norfakta | 8–9 May 2018 | 1,000 | 81.0 | 3.2 | 6.9 | 3.0 | 24.7 | 10.5 | 3.9 | 3.9 | 26.7 | 15.4 | 1.8 | 2.0 |
| Respons Analyse | 3–7 May 2018 | 1,002 | – | 3.5 | 7.3 | 3.2 | 25.5 | 9.5 | 3.5 | 3.7 | 26.2 | 16.1 | 1.5 | 0.7 |
| Norstat | 30 Apr–7 May 2018 | 703 | – | 3.5 | 6.5 | 3.2 | 26.0 | 11.0 | 3.8 | 3.0 | 25.5 | 15.9 | 1.6 | 0.5 |
| Kantar TNS | 30 Apr–2 May 2018 | 982 | 78.9 | 3.8 | 7.6 | 2.3 | 23.8 | 10.3 | 4.1 | 4.7 | 28.1 | 14.7 | 0.7 | 4.3 |
| Norstat | 26–30 Apr 2018 | 933 | – | 4.0 | 6.8 | 2.9 | 24.0 | 10.9 | 3.7 | 3.7 | 26.4 | 15.3 | 2.4 | 2.4 |
| Ipsos MMI | 23–25 Apr 2018 | 941 | – | 4.7 | 6.0 | 3.0 | 23.2 | 11.9 | 4.0 | 4.4 | 24.9 | 16.0 | 1.8 | 1.7 |
| Sentio | 17–23 Apr 2018 | 1,000 | 68.3 | 2.8 | 7.3 | 3.0 | 23.8 | 11.9 | 3.6 | 4.9 | 25.2 | 15.7 | 1.7 | 1.4 |
| Opinion Perduco | 10–16 Apr 2018 | 945 | 75.0 | 4.9 | 7.7 | 1.9 | 24.0 | 11.5 | 4.1 | 4.0 | 27.0 | 13.5 | 1.4 | 3.0 |
| Respons Analyse | 5–9 Apr 2018 | 1,001 | – | 3.9 | 6.2 | 3.1 | 23.4 | 10.9 | 4.1 | 4.5 | 25.8 | 16.2 | 1.8 | 2.4 |
| Norstat | 3–9 Apr 2018 | 925 | – | 3.8 | 7.5 | 2.5 | 25.2 | 10.7 | 3.7 | 3.7 | 25.1 | 15.8 | 1.9 | 0.1 |
| Kantar TNS | 3–6 Apr 2018 | 971 | 79.5 | 5.4 | 8.7 | 2.9 | 24.1 | 9.0 | 2.8 | 3.7 | 26.4 | 16.2 | 1.0 | 2.3 |
| Norfakta | 3–4 Apr 2018 | 1,000 | – | 4.3 | 7.4 | 3.0 | 23.2 | 10.6 | 3.6 | 4.1 | 26.5 | 17.4 | 0.1 | 3.3 |
| Norstat | 20–24 Mar 2018 | 955 | – | 4.0 | 6.6 | 2.3 | 24.3 | 11.0 | 4.3 | 4.8 | 25.3 | 15.4 | 1.9 | 1.0 |
| Ipsos MMI | 19–21 Mar 2018 | 935 | – | 3.3 | 6.6 | 2.4 | 23.7 | 10.2 | 3.2 | 3.8 | 23.9 | 20.8 | 2.2 | 0.2 |
| Kantar TNS | 20 Mar 2018 | 600 | 83.0 | 1.7 | 5.6 | 2.1 | 23.6 | 10.3 | 5.0 | 4.4 | 26.0 | 20.6 | 0.9 | 2.4 |
| Sentio | 13–19 Mar 2018 | 1,000 | 71.0 | 4.0 | 7.1 | 2.6 | 23.3 | 11.9 | 3.5 | 4.1 | 26.6 | 15.8 | 1.1 | 3.3 |
| Respons Analyse | 15–16 Mar 2018 | 1,002 | – | 2.5 | 6.4 | 3.1 | 25.1 | 10.8 | 4.4 | 3.2 | 26.9 | 15.9 | 1.7 | 1.8 |
| Opinion Perduco | 6–12 Mar 2018 | 951 | 72.0 | 4.5 | 6.9 | 3.2 | 23.3 | 11.0 | 4.6 | 3.6 | 27.3 | 14.5 | 1.1 | 4.0 |
| Norfakta | 6–7 Mar 2018 | 1,001 | 79.0 | 3.3 | 6.9 | 3.9 | 22.5 | 12.8 | 3.8 | 3.9 | 28.4 | 12.7 | 1.8 | 5.9 |
| Respons Analyse | 1–5 Mar 2018 | 1,003 | – | 3.1 | 7.2 | 3.1 | 23.4 | 11.6 | 4.7 | 4.4 | 28.0 | 13.1 | 1.4 | 4.6 |
| Norstat | 27 Feb–5 Mar 2018 | 930 | – | 3.2 | 7.0 | 2.8 | 23.3 | 12.3 | 4.3 | 3.2 | 27.4 | 15.0 | 1.5 | 4.1 |
| Kantar TNS | 26 Feb–3 Mar 2018 | 980 | 82.9 | 3.8 | 6.6 | 3.6 | 23.4 | 12.1 | 4.9 | 4.5 | 29.3 | 10.9 | 1.0 | 5.9 |
| Norstat | 20–25 Feb 2018 | 933 | – | 3.1 | 6.0 | 3.3 | 24.5 | 10.8 | 3.5 | 4.5 | 28.8 | 12.9 | 2.5 | 4.3 |
| Ipsos MMI | 19–21 Feb 2018 | 950 | – | 3.3 | 7.5 | 3.0 | 25.4 | 9.7 | 4.4 | 3.5 | 27.3 | 13.6 | 2.3 | 1.9 |
| Sentio | 13–19 Feb 2018 | 1,000 | 74.3 | 3.2 | 6.1 | 3.2 | 23.3 | 10.4 | 4.1 | 5.1 | 28.7 | 15.0 | 0.9 | 5.4 |
| Opinion Perduco | 6–12 Feb 2018 | 944 | 74.0 | 4.0 | 7.3 | 4.0 | 21.4 | 10.0 | 3.9 | 3.6 | 29.2 | 15.9 | 0.8 | 7.8 |
| Respons Analyse | 5–7 Feb 2018 | 1,002 | – | 3.3 | 7.2 | 3.6 | 24.0 | 10.9 | 4.5 | 3.6 | 27.9 | 13.6 | 1.4 | 3.9 |
| Norstat | 30 Jan–5 Feb 2018 | 943 | – | 2.9 | 8.6 | 3.7 | 22.4 | 11.2 | 3.8 | 3.9 | 28.9 | 13.1 | 1.5 | 6.5 |
| Kantar TNS | 29 Jan–5 Feb 2018 | 985 | 80.7 | 3.6 | 6.3 | 3.4 | 23.6 | 11.2 | 5.8 | 3.8 | 29.1 | 12.0 | 1.1 | 5.5 |
| Norfakta | 30–31 Jan 2018 | 1,003 | 77.0 | 2.6 | 7.7 | 3.5 | 23.9 | 11.0 | 4.2 | 4.3 | 27.9 | 13.4 | 1.5 | 4.0 |
| Norstat | 23–28 Jan 2018 | 936 | – | 2.8 | 7.4 | 2.7 | 22.7 | 11.0 | 4.0 | 4.3 | 29.9 | 12.8 | 2.3 | 7.2 |
| Ipsos MMI | 22–24 Jan 2018 | 893 | – | 3.0 | 7.6 | 3.0 | 25.4 | 12.1 | 4.6 | 3.7 | 26.2 | 12.5 | 1.9 | 0.8 |
| Sentio | 16–21 Jan 2018 | 1,000 | 70.2 | 3.1 | 7.6 | 3.2 | 22.7 | 10.1 | 3.0 | 4.5 | 30.5 | 13.4 | 2.0 | 7.8 |
| Opinion Perduco | 9–15 Jan 2018 | 968 | 72.0 | 3.0 | 7.3 | 3.0 | 20.8 | 10.8 | 4.5 | 4.6 | 30.1 | 14.5 | 1.0 | 9.3 |
| Respons Analyse | 10–12 Jan 2018 | 1,000 | – | 2.9 | 7.5 | 2.8 | 23.2 | 11.3 | 4.1 | 4.4 | 29.4 | 13.2 | 1.2 | 6.2 |
| Respons Analyse | 8–10 Jan 2018 | 1,000 | 81.0 | 2.7 | 7.7 | 2.7 | 23.1 | 10.7 | 4.1 | 4.1 | 27.1 | 15.5 | 2.3 | 4.0 |
| Kantar TNS | 3–9 Jan 2018 | 968 | 80.6 | 3.0 | 8.6 | 2.6 | 19.4 | 10.9 | 4.3 | 4.5 | 30.5 | 14.8 | 1.5 | 11.1 |
| Norstat | 2–8 Jan 2018 | 977 | – | 2.9 | 8.3 | 2.7 | 20.1 | 12.2 | 3.6 | 4.6 | 28.7 | 14.9 | 2.0 | 8.6 |
| Norfakta | 2–3 Jan 2018 | 1,000 | – | 3.1 | 5.7 | 3.8 | 24.2 | 10.3 | 4.7 | 3.3 | 29.1 | 14.5 | 1.4 | 4.9 |
| 2017 election | 11 Sep 2017 | — | 78.3 | 2.4 | 6.0 | 3.2 | 27.4 | 10.3 | 4.4 | 4.2 | 25.0 | 15.2 | 1.7 | 2.4 |
2017
| Polling firm | Fieldwork date | Sample size | Resp. | R | SV | MDG | Ap | Sp | V | KrF | H | FrP | Others | Lead |
|---|---|---|---|---|---|---|---|---|---|---|---|---|---|---|
| Ipsos MMI | 18–20 Dec 2017 | 929 | – | 1.9 | 8.0 | 2.6 | 26.3 | 10.1 | 4.8 | 4.3 | 26.5 | 13.7 | 1.9 | 0.2 |
| Norstat | 12–18 Dec 2017 | 949 | – | 2.9 | 8.4 | 3.6 | 26.0 | 10.6 | 3.4 | 3.6 | 26.5 | 13.9 | 1.2 | 0.5 |
| Sentio | 5–11 Dec 2017 | 1,000 | 76.8 | 2.6 | 6.0 | 3.7 | 25.9 | 10.6 | 3.5 | 4.6 | 26.5 | 14.9 | 1.7 | 0.6 |
| Kantar TNS | 4–8 Dec 2017 | 974 | 79.6 | 2.8 | 6.9 | 3.5 | 26.0 | 9.7 | 4.3 | 4.1 | 26.6 | 14.8 | 1.3 | 0.6 |
| Norfakta | 5–6 Dec 2017 | 1,000 | 83.0 | 2.1 | 7.0 | 3.3 | 26.7 | 10.2 | 4.7 | 3.7 | 27.5 | 13.6 | 1.2 | 0.8 |
| Opinion Perduco | 28 Nov–4 Dec 2017 | 960 | 76.0 | 2.5 | 6.0 | 4.4 | 26.6 | 11.5 | 3.4 | 3.9 | 25.8 | 14.9 | 0.9 | 0.8 |
| Norstat | 21–27 Nov 2017 | 939 | – | 1.7 | 7.1 | 2.9 | 25.8 | 11.2 | 3.9 | 4.6 | 26.8 | 14.7 | 1.2 | 1.0 |
| Ipsos MMI | 20–22 Nov 2017 | 918 | – | 2.8 | 5.4 | 3.9 | 27.9 | 8.6 | 4.8 | 3.8 | 25.0 | 15.9 | 1.9 | 2.9 |
| Norstat | 14–20 Nov 2017 | 955 | – | 2.9 | 7.0 | 2.9 | 27.1 | 9.3 | 3.8 | 4.0 | 26.1 | 16.1 | 0.8 | 1.0 |
| Sentio | 7–13 Nov 2017 | 1,000 | 79.2 | 3.0 | 6.7 | 2.8 | 25.6 | 10.9 | 3.9 | 4.0 | 28.2 | 13.2 | 1.7 | 2.6 |
| Kantar TNS | 6–10 Nov 2017 | 972 | 85.4 | 3.9 | 7.4 | 1.9 | 25.3 | 11.5 | 5.9 | 3.1 | 26.9 | 12.7 | 1.4 | 1.6 |
| Norfakta | 7–8 Nov 2017 | 1,003 | 85.0 | 3.3 | 7.3 | 1.9 | 26.6 | 10.5 | 3.7 | 3.2 | 27.0 | 14.6 | 1.9 | 0.4 |
| Opinion Perduco | 31 Oct–6 Nov 2017 | 956 | 79.0 | 2.8 | 7.3 | 3.8 | 25.1 | 11.2 | 4.3 | 4.0 | 25.7 | 14.9 | 0.9 | 0.6 |
| Norstat | 25–31 Oct 2017 | 937 | – | 2.4 | 7.5 | 2.7 | 26.0 | 11.7 | 3.7 | 4.2 | 25.9 | 14.5 | 1.5 | 0.1 |
| Ipsos MMI | 23–25 Oct 2017 | 947 | – | 3.4 | 5.9 | 2.9 | 27.4 | 10.9 | 3.8 | 3.7 | 25.8 | 13.5 | 2.7 | 1.6 |
| Norstat | 17–23 Oct 2017 | 942 | – | 3.2 | 6.5 | 3.2 | 26.5 | 10.7 | 4.9 | 4.1 | 25.6 | 13.7 | 1.6 | 0.9 |
| Sentio | 10–16 Oct 2017 | 1,000 | 79.9 | 3.1 | 7.3 | 4.9 | 25.2 | 10.2 | 4.6 | 3.2 | 25.2 | 14.6 | 1.8 | Tie |
| Opinion Perduco | 3–9 Oct 2017 | 958 | 80.0 | 2.2 | 6.0 | 4.8 | 25.8 | 10.6 | 4.1 | 4.1 | 26.7 | 14.9 | 0.8 | 0.9 |
| Kantar TNS | 2–6 Oct 2017 | 975 | – | 3.7 | 6.4 | 3.4 | 25.4 | 9.3 | 4.8 | 3.2 | 29.2 | 13.1 | 1.6 | 3.8 |
| Norfakta | 3–4 Oct 2017 | 1,000 | 85.0 | 1.8 | 6.5 | 3.6 | 25.8 | 11.4 | 3.4 | 4.4 | 27.6 | 13.4 | 2.1 | 1.8 |
| Norstat | 27 Sep–1 Oct 2017 | 941 | – | 2.5 | 7.5 | 3.0 | 26.4 | 10.6 | 4.2 | 3.9 | 25.6 | 14.3 | 1.9 | 0.8 |
| Ipsos MMI | 25–27 Sep 2017 | 935 | – | 2.7 | 7.4 | 3.3 | 26.1 | 10.2 | 5.4 | 3.9 | 24.4 | 14.4 | 2.3 | 1.7 |
| Norstat | 19–25 Sep 2017 | 936 | – | 3.7 | 7.3 | 2.8 | 24.9 | 11.3 | 4.7 | 3.2 | 25.1 | 15.0 | 1.9 | 0.2 |
| Sentio | 12–18 Sep 2017 | 1,000 | 80.1 | 2.4 | 6.4 | 3.3 | 26.2 | 11.4 | 3.9 | 3.9 | 26.8 | 14.7 | 0.9 | 0.6 |
| 2017 election | 11 Sep 2017 | — | 78.3 | 2.4 | 6.0 | 3.2 | 27.4 | 10.3 | 4.4 | 4.2 | 25.0 | 15.2 | 1.7 | 2.4 |