In biology, phylogenetics is the study of the evolutionary history and relationships among or within groups of organisms. These relationships are determined by phylogenetic inference methods that focus on observed heritable traits, such as DNA sequences, protein amino acid sequences, or morphology. The result of such an analysis is a phylogenetic tree—a diagram containing a hypothesis of relationships that reflects the evolutionary history of a group of organisms.

A cladogram is a diagram used in cladistics to show relations among organisms. A cladogram is not, however, an evolutionary tree because it does not show how ancestors are related to descendants, nor does it show how much they have changed, so many differing evolutionary trees can be consistent with the same cladogram. A cladogram uses lines that branch off in different directions ending at a clade, a group of organisms with a last common ancestor. There are many shapes of cladograms but they all have lines that branch off from other lines. The lines can be traced back to where they branch off. These branching off points represent a hypothetical ancestor which can be inferred to exhibit the traits shared among the terminal taxa above it. This hypothetical ancestor might then provide clues about the order of evolution of various features, adaptation, and other evolutionary narratives about ancestors. Although traditionally such cladograms were generated largely on the basis of morphological characters, DNA and RNA sequencing data and computational phylogenetics are now very commonly used in the generation of cladograms, either on their own or in combination with morphology.
Molecular phylogenetics is the branch of phylogeny that analyzes genetic, hereditary molecular differences, predominantly in DNA sequences, to gain information on an organism's evolutionary relationships. From these analyses, it is possible to determine the processes by which diversity among species has been achieved. The result of a molecular phylogenetic analysis is expressed in a phylogenetic tree. Molecular phylogenetics is one aspect of molecular systematics, a broader term that also includes the use of molecular data in taxonomy and biogeography.

Cluster analysis or clustering is the task of grouping a set of objects in such a way that objects in the same group are more similar to each other than to those in other groups (clusters). It is a main task of exploratory data analysis, and a common technique for statistical data analysis, used in many fields, including pattern recognition, image analysis, information retrieval, bioinformatics, data compression, computer graphics and machine learning.
The Akaike information criterion (AIC) is an estimator of prediction error and thereby relative quality of statistical models for a given set of data. Given a collection of models for the data, AIC estimates the quality of each model, relative to each of the other models. Thus, AIC provides a means for model selection.

Multiple-criteria decision-making (MCDM) or multiple-criteria decision analysis (MCDA) is a sub-discipline of operations research that explicitly evaluates multiple conflicting criteria in decision making. Conflicting criteria are typical in evaluating options: cost or price is usually one of the main criteria, and some measure of quality is typically another criterion, easily in conflict with the cost. In purchasing a car, cost, comfort, safety, and fuel economy may be some of the main criteria we consider – it is unusual that the cheapest car is the most comfortable and the safest one. In portfolio management, managers are interested in getting high returns while simultaneously reducing risks; however, the stocks that have the potential of bringing high returns typically carry high risk of losing money. In a service industry, customer satisfaction and the cost of providing service are fundamental conflicting criteria.
In phylogenetics, maximum parsimony is an optimality criterion under which the phylogenetic tree that minimizes the total number of character-state changes. Under the maximum-parsimony criterion, the optimal tree will minimize the amount of homoplasy. In other words, under this criterion, the shortest possible tree that explains the data is considered best. Some of the basic ideas behind maximum parsimony were presented by James S. Farris in 1970 and Walter M. Fitch in 1971.

In machine learning and statistics, feature selection, also known as variable selection, attribute selection or variable subset selection, is the process of selecting a subset of relevant features for use in model construction. Feature selection techniques are used for several reasons:

In the design of experiments, optimal designs are a class of experimental designs that are optimal with respect to some statistical criterion. The creation of this field of statistics has been credited to Danish statistician Kirstine Smith.

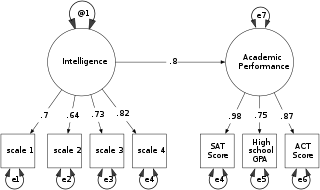
Structural equation modeling (SEM) is a label for a diverse set of methods used by scientists doing both observational and experimental research. SEM is used mostly in the social and behavioral sciences but it is also used in epidemiology, business, and other fields. A definition of SEM is difficult without reference to technical language, but a good starting place is the name itself.
Model selection is the task of selecting a model from among various candidates on the basis of performance criterion to choose the best one. In the context of learning, this may be the selection of a statistical model from a set of candidate models, given data. In the simplest cases, a pre-existing set of data is considered. However, the task can also involve the design of experiments such that the data collected is well-suited to the problem of model selection. Given candidate models of similar predictive or explanatory power, the simplest model is most likely to be the best choice.
Computational phylogenetics is the application of computational algorithms, methods, and programs to phylogenetic analyses. The goal is to assemble a phylogenetic tree representing a hypothesis about the evolutionary ancestry of a set of genes, species, or other taxa. For example, these techniques have been used to explore the family tree of hominid species and the relationships between specific genes shared by many types of organisms.

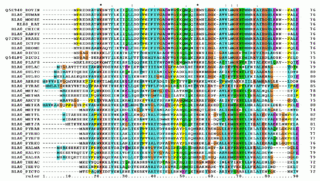
Multiple sequence alignment (MSA) may refer to the process or the result of sequence alignment of three or more biological sequences, generally protein, DNA, or RNA. In many cases, the input set of query sequences are assumed to have an evolutionary relationship by which they share a linkage and are descended from a common ancestor. From the resulting MSA, sequence homology can be inferred and phylogenetic analysis can be conducted to assess the sequences' shared evolutionary origins. Visual depictions of the alignment as in the image at right illustrate mutation events such as point mutations that appear as differing characters in a single alignment column, and insertion or deletion mutations that appear as hyphens in one or more of the sequences in the alignment. Multiple sequence alignment is often used to assess sequence conservation of protein domains, tertiary and secondary structures, and even individual amino acids or nucleotides.
Ancestral reconstruction is the extrapolation back in time from measured characteristics of individuals to their common ancestors. It is an important application of phylogenetics, the reconstruction and study of the evolutionary relationships among individuals, populations or species to their ancestors. In the context of evolutionary biology, ancestral reconstruction can be used to recover different kinds of ancestral character states of organisms that lived millions of years ago. These states include the genetic sequence, the amino acid sequence of a protein, the composition of a genome, a measurable characteristic of an organism (phenotype), and the geographic range of an ancestral population or species. This is desirable because it allows us to examine parts of phylogenetic trees corresponding to the distant past, clarifying the evolutionary history of the species in the tree. Since modern genetic sequences are essentially a variation of ancient ones, access to ancient sequences may identify other variations and organisms which could have arisen from those sequences. In addition to genetic sequences, one might attempt to track the changing of one character trait to another, such as fins turning to legs.
Tree rearrangements are deterministic algorithms devoted to searching for an optimal tree structure. They can be applied to any set of data that are naturally arranged into a tree, but have most applications in computational phylogenetics, especially in maximum parsimony and maximum likelihood searches of phylogenetic trees, which seek to identify one among many possible trees that best explains the evolutionary history of a particular gene or species.
Distance matrices are used in phylogeny as non-parametric distance methods and were originally applied to phenetic data using a matrix of pairwise distances. These distances are then reconciled to produce a tree. The distance matrix can come from a number of different sources, including measured distance or morphometric analysis, various pairwise distance formulae applied to discrete morphological characters, or genetic distance from sequence, restriction fragment, or allozyme data. For phylogenetic character data, raw distance values can be calculated by simply counting the number of pairwise differences in character states.
Quantitative comparative linguistics is the use of quantitative analysis as applied to comparative linguistics. Examples include the statistical fields of lexicostatistics and glottochronology, and the borrowing of phylogenetics from biology.

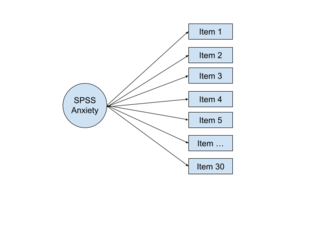
In multivariate statistics, exploratory factor analysis (EFA) is a statistical method used to uncover the underlying structure of a relatively large set of variables. EFA is a technique within factor analysis whose overarching goal is to identify the underlying relationships between measured variables. It is commonly used by researchers when developing a scale and serves to identify a set of latent constructs underlying a battery of measured variables. It should be used when the researcher has no a priori hypothesis about factors or patterns of measured variables. Measured variables are any one of several attributes of people that may be observed and measured. Examples of measured variables could be the physical height, weight, and pulse rate of a human being. Usually, researchers would have a large number of measured variables, which are assumed to be related to a smaller number of "unobserved" factors. Researchers must carefully consider the number of measured variables to include in the analysis. EFA procedures are more accurate when each factor is represented by multiple measured variables in the analysis.
Comparison of electoral systems is the result of comparative politics for electoral systems. Electoral systems are the rules for conducting elections, a main component of which is the algorithm for determining the winner from the ballots cast. This article discusses methods and results of comparing different electoral systems, both those that elect a unique candidate in a 'single-winner' election and those that elect a group of representatives in a multiwinner election.
Minimum evolution is a distance method employed in phylogenetics modeling. It shares with maximum parsimony the aspect of searching for the phylogeny that has the shortest total sum of branch lengths.


