Econometrics is the application of statistical methods to economic data in order to give empirical content to economic relationships. More precisely, it is "the quantitative analysis of actual economic phenomena based on the concurrent development of theory and observation, related by appropriate methods of inference". An introductory economics textbook describes econometrics as allowing economists "to sift through mountains of data to extract simple relationships". The first known use of the term "econometrics" was by Polish economist Paweł Ciompa in 1910. Jan Tinbergen is considered by many to be one of the founding fathers of econometrics. Ragnar Frisch is credited with coining the term in the sense in which it is used today.
Multivariate statistics is a subdivision of statistics encompassing the simultaneous observation and analysis of more than one outcome variable. The application of multivariate statistics is multivariate analysis.
Psychological statistics is application of formulas, theorems, numbers and laws to psychology. Statistical Methods for psychology include development and application statistical theory and methods for modeling psychological data. These methods include psychometrics, Factor analysis, Experimental Designs, Multivariate Behavioral Research. The article also discusses journals in the same field Wilcox, R. (2012).

In statistics, dependence or association is any statistical relationship, whether causal or not, between two random variables or bivariate data. In the broadest sense correlation is any statistical association, though it commonly refers to the degree to which a pair of variables are linearly related. Familiar examples of dependent phenomena include the correlation between the physical statures of parents and their offspring, and the correlation between the demand for a limited supply product and its price.
Simultaneous equation models are a type of statistical model in the form of a set of linear simultaneous equations. They are often used in econometrics. One can estimate these models equation by equation; however, estimation methods that exploit the system of equations, such as generalized method of moments (GMM) and instrumental variables estimation (IV) tend to be more efficient.
In statistics, a spurious relationship or spurious correlation is a mathematical relationship in which two or more events or variables are associated but not causally related, due to either coincidence or the presence of a certain third, unseen factor.
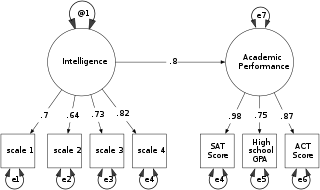
In statistics, path analysis is used to describe the directed dependencies among a set of variables. This includes models equivalent to any form of multiple regression analysis, factor analysis, canonical correlation analysis, discriminant analysis, as well as more general families of models in the multivariate analysis of variance and covariance analyses.

In statistical modeling, regression analysis is a set of statistical processes for estimating the relationships among variables. It includes many techniques for modeling and analyzing several variables, when the focus is on the relationship between a dependent variable and one or more independent variables. More specifically, regression analysis helps one understand how the typical value of the dependent variable changes when any one of the independent variables is varied, while the other independent variables are held fixed.

In statistics, the coefficient of determination, denoted R2 or r2 and pronounced "R squared", is the proportion of the variance in the dependent variable that is predictable from the independent variable(s).
In statistics, econometrics, epidemiology and related disciplines, the method of instrumental variables (IV) is used to estimate causal relationships when controlled experiments are not feasible or when a treatment is not successfully delivered to every unit in a randomized experiment. Intuitively, IVs are used when an explanatory variable of interest is correlated with the error term, in which case ordinary least squares and ANOVA give biased results. A valid instrument induces changes in the explanatory variable but has no independent effect on the dependent variable, allowing a researcher to uncover the causal effect of the explanatory variable on the dependent variable.
Multilevel models are statistical models of parameters that vary at more than one level. An example could be a model of student performance that contains measures for individual students as well as measures for classrooms within which the students are grouped. These models can be seen as generalizations of linear models, although they can also extend to non-linear models. These models became much more popular after sufficient computing power and software became available.
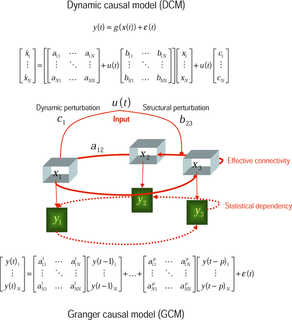
In philosophy of science, a causal model is a conceptual model that describes the causal mechanisms of a system. Causal models can improve study designs by providing clear rules for deciding which independent variables need to be included/controlled for.
In statistics, a mediation model is one that seeks to identify and explain the mechanism or process that underlies an observed relationship between an independent variable and a dependent variable via the inclusion of a third hypothetical variable, known as a mediator variable. Rather than a direct causal relationship between the independent variable and the dependent variable, a mediation model proposes that the independent variable influences the (non-observable) mediator variable, which in turn influences the dependent variable. Thus, the mediator variable serves to clarify the nature of the relationship between the independent and dependent variables.
In statistics, standardized [regression] coefficients, also called beta coefficients or beta weights, are the estimates resulting from a regression analysis that have been standardized so that the variances of dependent and independent variables are 1. Therefore, standardized coefficients refer to how many standard deviations a dependent variable will change, per standard deviation increase in the predictor variable. For simple linear regression with orthogonal predictors, the standardized regression coefficient equals the correlation between the independent and dependent variables.
Segmented regression, also known as piecewise regression or broken-stick regression, is a method in regression analysis in which the independent variable is partitioned into intervals and a separate line segment is fit to each interval. Segmented regression analysis can also be performed on multivariate data by partitioning the various independent variables. Segmented regression is useful when the independent variables, clustered into different groups, exhibit different relationships between the variables in these regions. The boundaries between the segments are breakpoints.
In statistics and regression analysis, moderation occurs when the relationship between two variables depends on a third variable. The third variable is referred to as the moderator variable or simply the moderator. The effect of a moderating variable is characterized statistically as an interaction; that is, a categorical or quantitative variable that affects the direction and/or strength of the relation between dependent and independent variables. Specifically within a correlational analysis framework, a moderator is a third variable that affects the zero-order correlation between two other variables, or the value of the slope of the dependent variable on the independent variable. In analysis of variance (ANOVA) terms, a basic moderator effect can be represented as an interaction between a focal independent variable and a factor that specifies the appropriate conditions for its operation.
A correlation coefficient is a numerical measure of some type of correlation, meaning a statistical relationship between two variables. The variables may be two columns of a given data set of observations, often called a sample, or two components of a multivariate random variable with a known distribution.
In statistics, econometrics, epidemiology, genetics and related disciplines, causal graphs are graphical models used to encode assumptions about the data-generating process. They can also be viewed as a blueprint of the algorithm by which Nature assigns values to the variables in the domain of interest.