
In mathematics, convolution is a mathematical operation on two functions that produces a third function. The term convolution refers to both the result function and to the process of computing it. It is defined as the integral of the product of the two functions after one is reflected about the y-axis and shifted. The integral is evaluated for all values of shift, producing the convolution function. The choice of which function is reflected and shifted before the integral does not change the integral result. Graphically, it expresses how the 'shape' of one function is modified by the other.
Digital signal processing (DSP) is the use of digital processing, such as by computers or more specialized digital signal processors, to perform a wide variety of signal processing operations. The digital signals processed in this manner are a sequence of numbers that represent samples of a continuous variable in a domain such as time, space, or frequency. In digital electronics, a digital signal is represented as a pulse train, which is typically generated by the switching of a transistor.
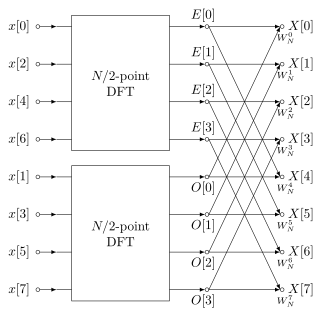
A Fast Fourier Transform (FFT) is an algorithm that computes the Discrete Fourier Transform (DFT) of a sequence, or its inverse (IDFT). Fourier analysis converts a signal from its original domain to a representation in the frequency domain and vice versa. The DFT is obtained by decomposing a sequence of values into components of different frequencies. This operation is useful in many fields, but computing it directly from the definition is often too slow to be practical. An FFT rapidly computes such transformations by factorizing the DFT matrix into a product of sparse factors. As a result, it manages to reduce the complexity of computing the DFT from , which arises if one simply applies the definition of DFT, to , where n is the data size. The difference in speed can be enormous, especially for long data sets where n may be in the thousands or millions. In the presence of round-off error, many FFT algorithms are much more accurate than evaluating the DFT definition directly or indirectly. There are many different FFT algorithms based on a wide range of published theories, from simple complex-number arithmetic to group theory and number theory.

Signal processing is an electrical engineering subfield that focuses on analyzing, modifying and synthesizing signals, such as sound, images, potential fields, seismic signals, altimetry processing, and scientific measurements. Signal processing techniques are used to optimize transmissions, digital storage efficiency, correcting distorted signals, subjective video quality, and to also detect or pinpoint components of interest in a measured signal.
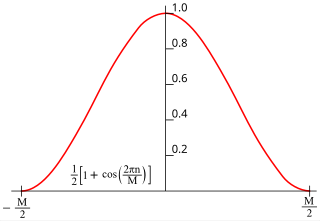
In signal processing and statistics, a window function is a mathematical function that is zero-valued outside of some chosen interval. Typically, windows functions are symmetric around the middle of the interval, approach a maximum in the middle, and taper away from the middle. Mathematically, when another function or waveform/data-sequence is "multiplied" by a window function, the product is also zero-valued outside the interval: all that is left is the part where they overlap, the "view through the window". Equivalently, and in actual practice, the segment of data within the window is first isolated, and then only that data is multiplied by the window function values. Thus, tapering, not segmentation, is the main purpose of window functions.

In mathematics, deconvolution is the inverse of convolution. Both operations are used in signal processing and image processing. For example, it may be possible to recover the original signal after a filter (convolution) by using a deconvolution method with a certain degree of accuracy. Due to the measurement error of the recorded signal or image, it can be demonstrated that the worse the signal-to-noise ratio (SNR), the worse the reversing of a filter will be; hence, inverting a filter is not always a good solution as the error amplifies. Deconvolution offers a solution to this problem.
In signal processing and electronics, the frequency response of a system is the quantitative measure of the magnitude and phase of the output as a function of input frequency. The frequency response is widely used in the design and analysis of systems, such as audio and control systems, where they simplify mathematical analysis by converting governing differential equations into algebraic equations. In an audio system, it may be used to minimize audible distortion by designing components so that the overall response is as flat (uniform) as possible across the system's bandwidth. In control systems, such as a vehicle's cruise control, it may be used to assess system stability, often through the use of Bode plots. Systems with a specific frequency response can be designed using analog and digital filters.

In mathematics, a time series is a series of data points indexed in time order. Most commonly, a time series is a sequence taken at successive equally spaced points in time. Thus it is a sequence of discrete-time data. Examples of time series are heights of ocean tides, counts of sunspots, and the daily closing value of the Dow Jones Industrial Average.
In signal processing, a periodogram is an estimate of the spectral density of a signal. The term was coined by Arthur Schuster in 1898. Today, the periodogram is a component of more sophisticated methods. It is the most common tool for examining the amplitude vs frequency characteristics of FIR filters and window functions. FFT spectrum analyzers are also implemented as a time-sequence of periodograms.
Welch's method, named after Peter D. Welch, is an approach for spectral density estimation. It is used in physics, engineering, and applied mathematics for estimating the power of a signal at different frequencies. The method is based on the concept of using periodogram spectrum estimates, which are the result of converting a signal from the time domain to the frequency domain. Welch's method is an improvement on the standard periodogram spectrum estimating method and on Bartlett's method, in that it reduces noise in the estimated power spectra in exchange for reducing the frequency resolution. Due to the noise caused by imperfect and finite data, the noise reduction from Welch's method is often desired.

Athanasios Papoulis was a Greek-American engineer and applied mathematician.
James William Cooley was an American mathematician. Cooley received a B.A. degree in 1949 from Manhattan College, Bronx, NY, an M.A. degree in 1951 from Columbia University, New York, NY, and a Ph.D. degree in 1961 in applied mathematics from Columbia University. He was a programmer on John von Neumann's computer at the Institute for Advanced Study, Princeton, NJ, from 1953 to 1956, where he notably programmed the Blackman–Tukey transformation.
In mathematics, in the area of statistical analysis, the bispectrum is a statistic used to search for nonlinear interactions.
Geophysical survey is the systematic collection of geophysical data for spatial studies. Detection and analysis of the geophysical signals forms the core of Geophysical signal processing. The magnetic and gravitational fields emanating from the Earth's interior hold essential information concerning seismic activities and the internal structure. Hence, detection and analysis of the electric and Magnetic fields is very crucial. As the Electromagnetic and gravitational waves are multi-dimensional signals, all the 1-D transformation techniques can be extended for the analysis of these signals as well. Hence this article also discusses multi-dimensional signal processing techniques.

Computational Engineering is an emerging discipline that deals with the development and application of computational models for engineering, known as Computational Engineering Models or CEM. Computational engineering uses computers to solve engineering design problems important to a variety of industries. At this time, various different approaches are summarized under the term Computational Engineering, including using computational geometry and virtual design for engineering tasks, often coupled with a simulation-driven approach In Computational Engineering, algorithms solve mathematical and logical models that describe engineering challenges, sometimes coupled with some aspect of AI, specifically Reinforcement Learning.
In statistical signal processing, the goal of spectral density estimation (SDE) or simply spectral estimation is to estimate the spectral density of a signal from a sequence of time samples of the signal. Intuitively speaking, the spectral density characterizes the frequency content of the signal. One purpose of estimating the spectral density is to detect any periodicities in the data, by observing peaks at the frequencies corresponding to these periodicities.

Fourier-transform infrared spectroscopy (FTIR) is a technique used to obtain an infrared spectrum of absorption or emission of a solid, liquid, or gas. An FTIR spectrometer simultaneously collects high-resolution spectral data over a wide spectral range. This confers a significant advantage over a dispersive spectrometer, which measures intensity over a narrow range of wavelengths at a time.
Piotr Indyk is Thomas D. and Virginia W. Cabot Professor in the Theory of Computation Group at the Computer Science and Artificial Intelligence Laboratory, Massachusetts Institute of Technology.
The Blackman–Tukey transformation is a digital signal processing method to transform data from the time domain to the frequency domain. It was originally programmed around 1953 by James Cooley for John Tukey at John von Neumann's Institute for Advanced Study as a way to get "good smoothed statistical estimates of power spectra without requiring large Fourier transforms." It was published by Ralph Beebe Blackman and John Tukey in 1958.
Multidimension spectral estimation is a generalization of spectral estimation, normally formulated for one-dimensional signals, to multidimensional signals or multivariate data, such as wave vectors.
