Playas | |
|---|---|
City | |
| General Villamil Playas | |
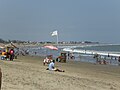
 A beach in Playas | |
 Flag | |
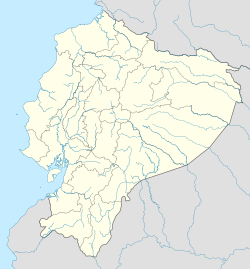 Playas Location in Ecuador | |
| Coordinates: 2°37′48″S80°23′24″W / 2.63000°S 80.39000°W | |
| Country | |
| Province | Guayas |
| Canton | Playas Canton |
| Parishes | List of urban parishes |
| Area | |
• City | 16.9 km2 (6.5 sq mi) |
| Population (2022 census) [1] | |
• City | 48,156 |
| • Density | 2,850/km2 (7,380/sq mi) |
| Time zone | UTC-5 (ECT) |
| Climate | Aw |
Playas (officially known as General Villamil Playas) is a coastal city located in the province of Guayas, Ecuador. It is the seat of Playas Canton, created in 1989. As of the census of 2022, the city had a population of 48,156. [1] The city takes its official name from the independence hero, General José de Villamil. Playas is an important tourist center and is located approximately 96 km from Guayaquil.