Related Research Articles
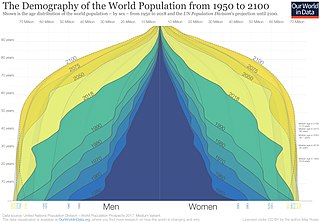
Demography is the statistical study of human populations: their size, composition, and how they change through the interplay of fertility (births), mortality (deaths), and migration.

The United States had an official estimated resident population of 334,914,895 on July 1, 2023, according to the U.S. Census Bureau. This figure includes the 50 states and the Washington, D.C. but excludes the population of five unincorporated U.S. territories as well as several minor island possessions. The United States is the third most populous country in the world, and the most populous in the Americas and the Western Hemisphere. The Census Bureau showed a population increase of 0.4% for the twelve-month period ending in July 2022, below the world average annual rate of 0.9%. The total fertility rate in the United States estimated for 2022 is 1.665 children per woman, which is below the replacement fertility rate of approximately 2.1. By several metrics, including racial and ethnic background, religious affiliation, and percentage of rural and urban divide, Illinois is the most representative of the larger demography of the United States.
The National Center for Health Statistics (NCHS) is a U.S. government agency that provides statistical information to guide actions and policies to improve the public health of the American people. It is a unit of the Centers for Disease Control and Prevention (CDC) and a principal agency of the U.S. Federal Statistical System. It is headquartered at University Town Center in Hyattsville, Maryland, just outside Washington, D.C.

In the United States of America, majority-minority area or minority-majority area is a term describing a U.S. state or jurisdiction whose population is composed of less than 50% non-Hispanic whites. Racial data is derived from self-identification questions on the U.S. census and on U.S. Census Bureau estimates.. The term is often used in voting rights law to designate voting districts that are designed under the Voting Rights Act to enable ethnic or language minorities "the opportunity to elect their candidate of choice." In that context, the term was first used by the Supreme Court in 1977. The Court had previously used the term in employment discrimination and labor relations cases.

The United States has a racially and ethnically diverse population. At the federal level, race and ethnicity have been categorized separately. The most recent United States census recognized five racial categories, as well as people who belong to two or more of the racial categories. The United States also recognizes the broader notion of ethnicity. The 2000 census and 2010 American Community Survey inquired about the "ancestry" of residents, while the 2020 census allowed people to enter their "origins". The Census Bureau also classified respondents as either Hispanic or Latino, identifying as an ethnicity, which comprises the minority group in the nation.
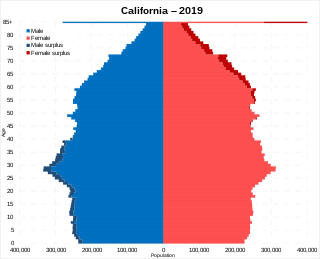
California is the most populated U.S. state, with an estimated population of 38.9 million as of 2023. It has people from a wide variety of ethnic, racial, national, and religious backgrounds.
According to the U.S. Census Bureau, as of 2023, Texas was the second largest state in population after California, with a population of 30,503,301, an increase of more than 1.3 million people, or 4.7%, since the 29,145,505 of the 2020 census. Its apportioned population in 2020 was 29,183,290. Since the beginning of the 21st century, the state of Texas has experienced strong population growth. Texas has many major cities and metropolitan areas, along with many towns and rural areas. Much of the population is concentrated in the major cities of Dallas–Fort Worth, Austin, San Antonio, Houston, McAllen, and El Paso and their corresponding metropolitan areas. The first four aforementioned main urban centers are also referred to as the Texas Triangle megaregion.

According to the U.S. Census Bureau, as of 2023, New York was the fourth largest state in population after California, Texas, and Florida, with a population of 19,571,216, a decrease of over 600,000 people, or −3.1%, since the 2020 census. The population change between 2000–2006 includes a natural increase of 601,779 people and a decrease due to net migration of 422,481 people out of the state. Immigration from outside the United States resulted in a net increase of 820,388 people, and migration within the country produced a net loss of about 800,213.

As of 2020, Alaska has a population of 733,391.

According to the U.S. Census Bureau, as of 2020, the state of Oklahoma had a population of 3,959,353, which is an increase of 208,002 or 5.54% since the year 2010. Oklahoma is the 28th most populous state in the United States.

South Dakota is the 46th-most populous U.S. state; in 2019, the U.S. Census Bureau estimated a population of about 884,659. The majority of South Dakotans are White, and the largest religion is Christianity. In 2010, 93.46% of the population spoke English as their primary language.
The demographics of Virginia are the various elements used to describe the population of the Commonwealth of Virginia and are studied by various government and non-government organizations. Virginia is the 12th-most populous state in the United States with over 8 million residents and is the 35th largest in area.
The District of Columbia is a federal district with an ethnically diverse population. In 2020, the District had a population of 689,545 people, with a resident density of 11,515 people per square mile.

Massachusetts has an estimated population of 6.981 million as of 2022 according to the U.S. Census Bureau. This represents a −0.7% decrease in population from the 2020 census, when the population was 7.029 million. Currently, Massachusetts is the sixteenth most populous U.S. state.

As of the 2020 United States census, Arizona had a population of 7,151,502.
Demographics of North Carolina covers the varieties of ethnic groups who reside in North Carolina and relevant trends.
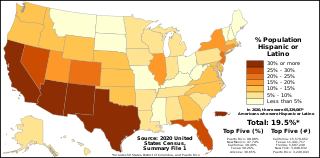
The demographics of Hispanic and Latino Americans depict a population that is the second-largest ethnic group in the United States, 62 million people or 18.7% of the national population.
Utah is the 30th most populous state in the United States with a population of about 3.3 million, according to projections from the US Census Bureau's 2017 estimates. The state has also been characterized by a tremendous amount of growth in the last decade, with the highest percent increase in population of any state since 2010. Utah has a surface area of 84,899 square miles, though around 80% of its population is concentrated around a metropolitan area in the north-central part of the state known as the Wasatch Front.
The Latin American diaspora refers to the dispersion of Latin Americans out of their homelands in Latin America and the communities subsequently established by them across the world.

The demographics of the City of Miami are monitored by the U.S. Census Bureau. Its population of nearly 450,000 ranks 44th in the United States and 2nd in Florida.
References
- 1 2 3 "Population and Housing Unit Estimates". US Census Bureau, Population Division. Retrieved 2019-09-20.
- ↑ Smith, Amy Symens (December 1998). "The American Community Survey and Intercensal Population Estimates: Where Are The Crossroads?" . Retrieved 2011-07-10.
- ↑ "American Community Survey". U.S. Census Bureau. Retrieved 20 September 2019.
- ↑ "American Community Survey (ACS) Questions and Answers". US Bureau of Labor Statistics, Local Area Unemployment Statistics Information and Analysis.
- ↑ "Methodology for the United States Resident Population Estimates by Age, Sex, Race, and Hispanic Origin (Vintage 2009): April 1, 2000 to July 1, 2009" (PDF). US Census Bureau, Population Division. Retrieved 2011-07-10.