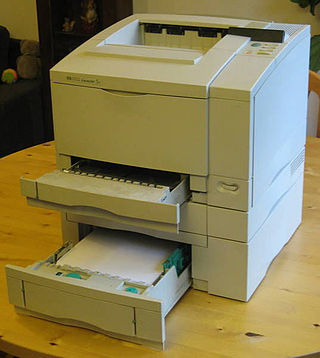
In computing, a printer is a peripheral machine which makes a persistent representation of graphics or text, usually on paper. While most output is human-readable, bar code printers are an example of an expanded use for printers. Different types of printers include 3D printers, inkjet printers, laser printers, and thermal printers.

A schematic, or schematic diagram, is a designed representation of the elements of a system using abstract, graphic symbols rather than realistic pictures. A schematic usually omits all details that are not relevant to the key information the schematic is intended to convey, and may include oversimplified elements in order to make this essential meaning easier to grasp, as well as additional organization of the information.

Technical drawing, drafting or drawing, is the act and discipline of composing drawings that visually communicate how something functions or is constructed.

A blueprint is a reproduction of a technical drawing or engineering drawing using a contact print process on light-sensitive sheets. Introduced by Sir John Herschel in 1842, the process allowed rapid and accurate production of an unlimited number of copies. It was widely used for over a century for the reproduction of specification drawings used in construction and industry. The blueprint process was characterized by white lines on a blue background, a negative of the original. The process was not able to reproduce color or shades of grey.

A table is an arrangement of information or data, typically in rows and columns, or possibly in a more complex structure. Tables are widely used in communication, research, and data analysis. Tables appear in print media, handwritten notes, computer software, architectural ornamentation, traffic signs, and many other places. The precise conventions and terminology for describing tables vary depending on the context. Further, tables differ significantly in variety, structure, flexibility, notation, representation and use. Information or data conveyed in table form is said to be in tabular format. In books and technical articles, tables are typically presented apart from the main text in numbered and captioned floating blocks.
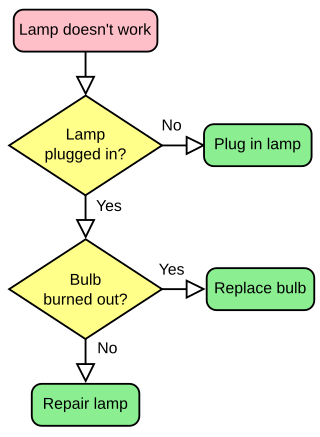
A flowchart is a type of diagram that represents a workflow or process. A flowchart can also be defined as a diagrammatic representation of an algorithm, a step-by-step approach to solving a task.
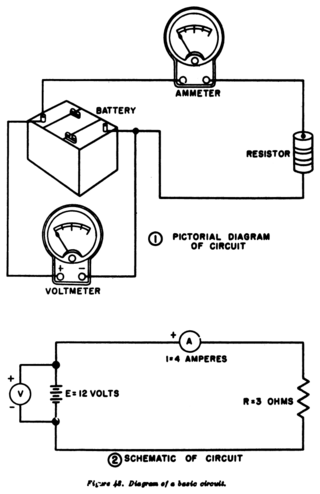
A circuit diagram is a graphical representation of an electrical circuit. A pictorial circuit diagram uses simple images of components, while a schematic diagram shows the components and interconnections of the circuit using standardized symbolic representations. The presentation of the interconnections between circuit components in the schematic diagram does not necessarily correspond to the physical arrangements in the finished device.
A diagram is a symbolic representation of information using visualization techniques. Diagrams have been used since prehistoric times on walls of caves, but became more prevalent during the Enlightenment. Sometimes, the technique uses a three-dimensional visualization which is then projected onto a two-dimensional surface. The word graph is sometimes used as a synonym for diagram.
A millwright is a craftsperson or skilled tradesperson who installs, dismantles, maintains, repairs, reassembles, and moves machinery in factories, power plants, and construction sites.

An entity–relationship model describes interrelated things of interest in a specific domain of knowledge. A basic ER model is composed of entity types and specifies relationships that can exist between entities.

Infographics are graphic visual representations of information, data, or knowledge intended to present information quickly and clearly. They can improve cognition by utilizing graphics to enhance the human visual system's ability to see patterns and trends. Similar pursuits are information visualization, data visualization, statistical graphics, information design, or information architecture. Infographics have evolved in recent years to be for mass communication, and thus are designed with fewer assumptions about the readers' knowledge base than other types of visualizations. Isotypes are an early example of infographics conveying information quickly and easily to the masses.
Tactile graphics, including tactile pictures, tactile diagrams, tactile maps, and tactile graphs, are images that use raised surfaces so that a visually impaired person can feel them. They are used to convey non-textual information such as maps, paintings, graphs and diagrams.
Interior communications electrician (IC) is a rating in the United States Navy. They operate and perform organizational and intermediate maintenance on alarm, warning, and indicator systems; interior communications; and ship's control, entertainment, and navigation systems. IC is one of the most versatile ratings in the U.S. Navy with equipment all the way forward, all the way aft, all the way up the mast and on the bottom of the ship. Members of this rating are commonly referred to as "IC-men" by Navy personnel.

Plans are a set of drawings or two-dimensional diagrams used to describe a place or object, or to communicate building or fabrication instructions. Usually plans are drawn or printed on paper, but they can take the form of a digital file.

A conveyor system is a common piece of mechanical handling equipment that moves materials from one location to another. Conveyors are especially useful in applications involving the transport of heavy or bulky materials. Conveyor systems allow quick and efficient transport for a wide variety of materials, which make them very popular in the material handling and packaging industries. They also have popular consumer applications, as they are often found in supermarkets and airports, constituting the final leg of item/ bag delivery to customers. Many kinds of conveying systems are available and are used according to the various needs of different industries. There are chain conveyors as well. Chain conveyors consist of enclosed tracks, I-Beam, towline, power & free, and hand pushed trolleys.
Electrical system design is the design of electrical systems. This can be as simple as a flashlight cell connected through two wires to a light bulb or as involved as the Space Shuttle. Electrical systems are groups of electrical components connected to carry out some operation. Often the systems are combined with other systems. They might be subsystems of larger systems and have subsystems of their own. For example, a subway rapid transit electrical system is composed of the wayside electrical power supply, wayside control system, and the electrical systems of each transit car. Each transit car’s electrical system is a subsystem of the subway system. Inside of each transit car there are also subsystems, such as the car climate control system.

yEd is a general-purpose diagramming program with a multi-document interface.
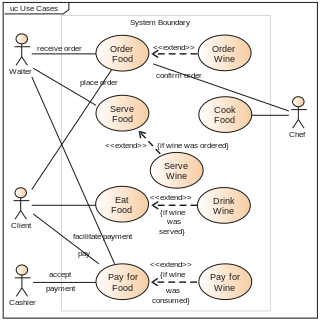
A use case diagram is a graphical depiction of a user's possible interactions with a system. A use case diagram shows various use cases and different types of users the system has and will often be accompanied by other types of diagrams as well. The use cases are represented by either circles or ellipses. The actors are often shown as stick figures.

A floral formula is a notation for representing the structure of particular types of flowers. Such notations use numbers, letters and various symbols to convey significant information in a compact form. They may represent the floral form of a particular species, or may be generalized to characterize higher taxa, usually giving ranges of numbers of organs. Floral formulae are one of the two ways of describing flower structure developed during the 19th century, the other being floral diagrams. The format of floral formulae differs according to the tastes of particular authors and periods, yet they tend to convey the same information.
A heliographic copier or heliographic duplicator is an apparatus used in the world of reprography for making contact prints on paper from original drawings made with that purpose on tracing paper, parchment paper or any other transparent or translucent material using different procedures. In general terms some type of heliographic copier is used for making: Hectographic prints, Ferrogallic prints, Gel-lithographs or Silver halide prints. All of them, until a certain size, can be achieved using a contact printer with an appropriate lamp but for big engineering and architectural plans, the heliographic copiers used with the cyanotype and the diazotype technologies, are of the roller type, which makes them completely different from contact printers.